Home Page |
MICHIGAN FORESTS FOREVER TEACHERS GUIDE
| ECONOMIC MEASURES AND WOOD-USING MILLS |  |
Forest economics is all about the role of wood and forest use in our communities and society. It is NOT simply about money. Dollar stocks and flows are measures of economic activity, not the definition. Forests are an integral piece in the life-blood of many of our communities and are essential to everyone. Try to imagine life without wood products! Or, think about Michigan lifestyles without forests! Keep in mind that each of us uses about 4.5 pounds of wood EACH day. That's equivalent to about half a 2 by 4.
Wood is a prime environmental solution to many
of our raw material requirements. The following essays provide excellent background
about the economic, environmental, and ethical use of wood.
Jim Bowyer,
Emeritus University of Minnesota, Department of Wood and Paper Science.
Patrick Moore, Co-founder of Greenpeace.
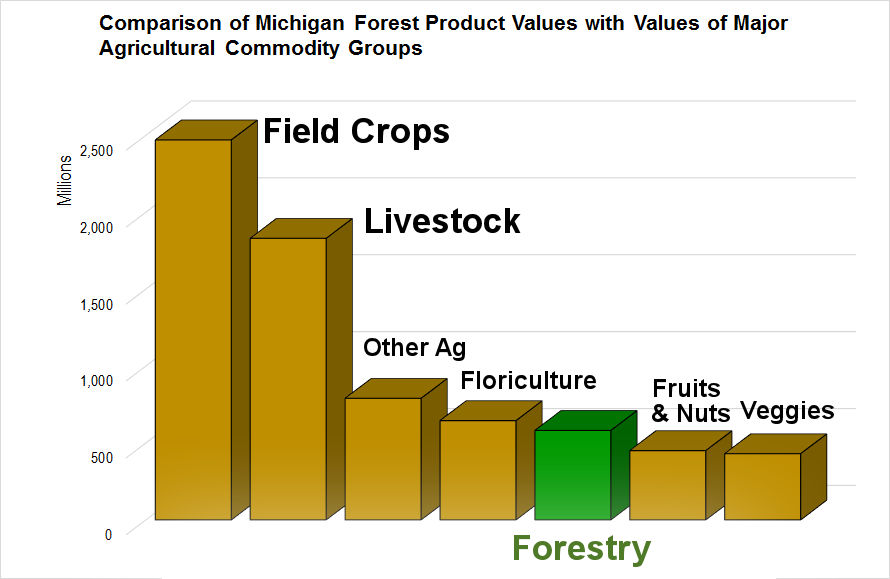
Not surprisingly, forest industries and wood-using industries comprise one of the largest economic sectors in Michigan. The annual monetary value exceeds 20 billion dollars (Leefers, 2014), and those figures are from 2012! In comparison, the Michigan Gross Domestic Product (GDP = the value of all goods and service generated within the state) is about $537 billion dollars in 2018. Just the annual value of raw wood products delivered to Michigan mills runs around 500 million dollars. Over 125,000 people work in these industries and support industries.
You will find differing values depending upon the analysis, but all of them are large numbers which illustrate one of the important aspects of our forests . . . a major driver in our state economy!
All these "facts" represent more than just numbers. They represent livelihoods, communities, schools, families, and much more. One of the best aspects of the forest industry is that it is dependent on raw materials that are not only recyclable and reusable, but they are also renewable! However, this page will deal mostly with some of the "cold, hard facts" about Michigan's forest industry.
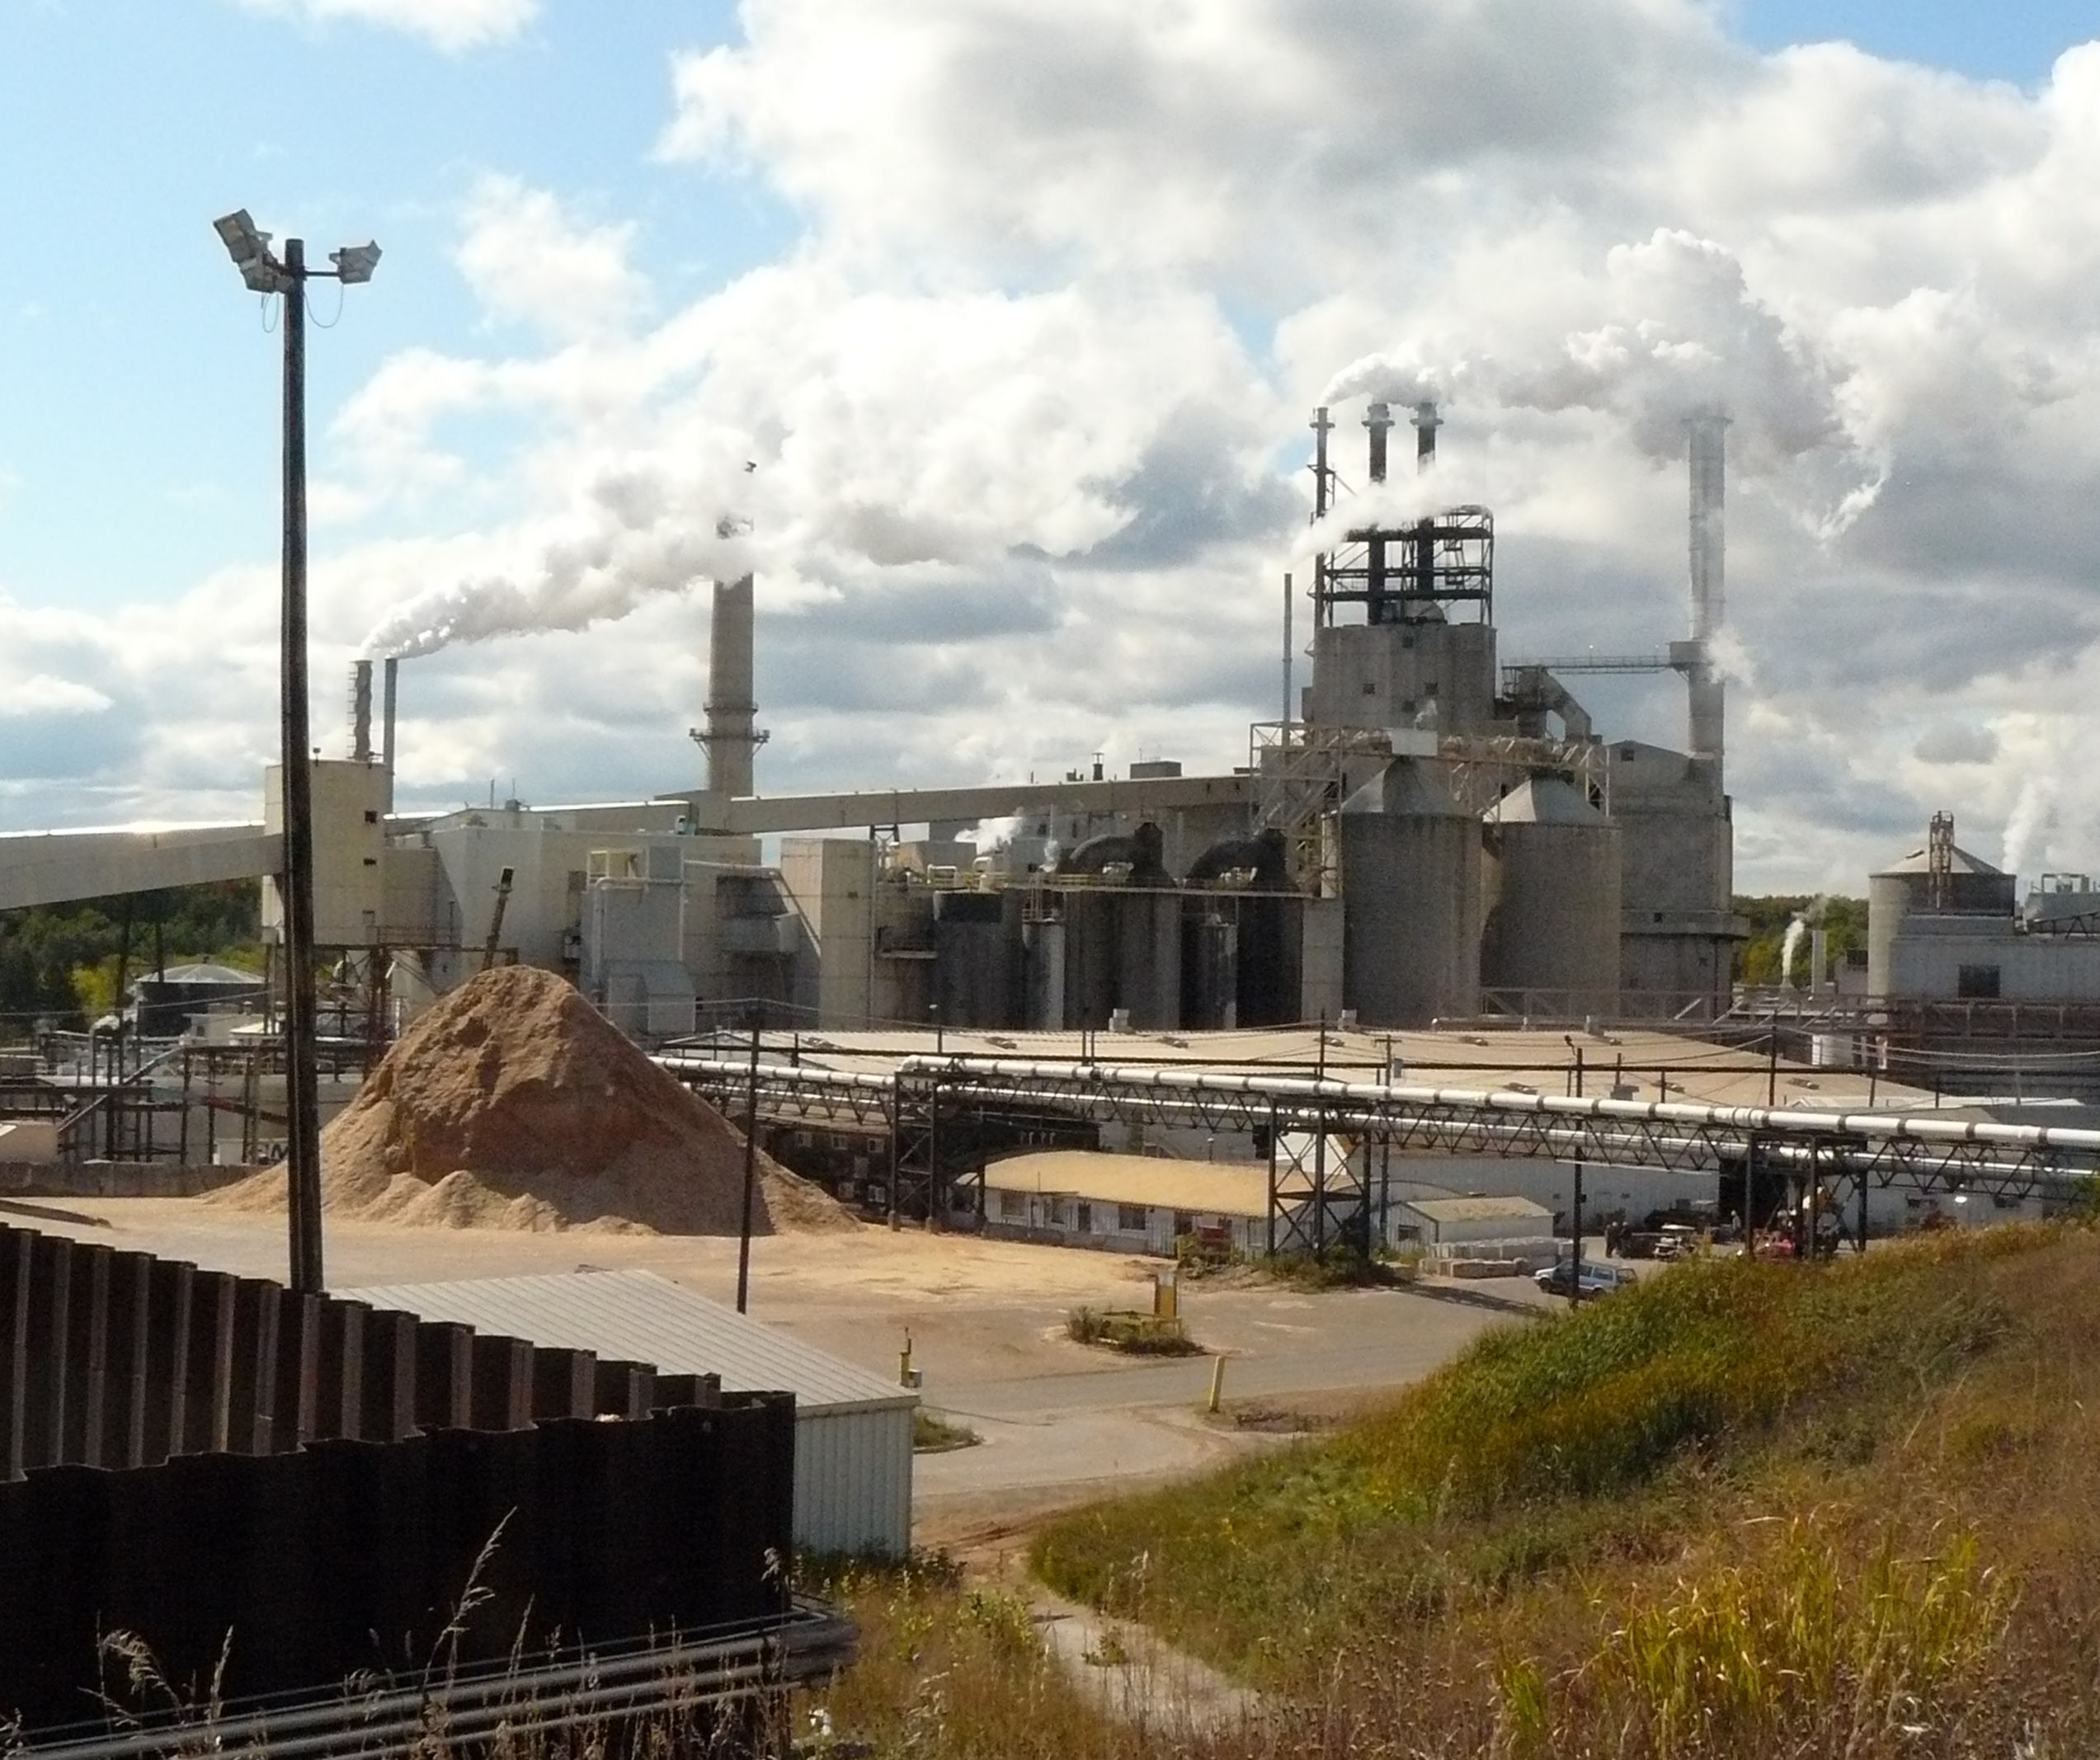
| Once manufactured and removed from the forest, logs, pulpwood, and
chips are delivered to
a wide range of mills that process the wood into either a useable product or material that
will be used in the manufacture of other products.
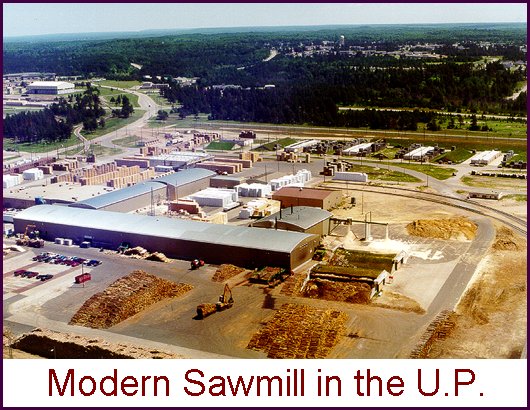
Most commonly, we think of sawlogs being sawn into lumber or peeled into veneer, and pulpwood being made into paper pulp. These are primary wood-using mills, and there are about 300 of them in Michigan. Secondary manufacturers will take the lumber, veneer, and pulp, and make them into the nearly 800 different products made in Michigan. We have 950 of these secondary manufacturers. Additionally, there are over 665 producers that manufacture logs, pulpwood, and other raw wood products. Wood-using mills are a valuable part of Michigan's forest industry and come in a wide variety of types. They occur in each of Michigan's 83 counties. A "primary" wood-using mill utilizes raw products from the forest (logs, chips, pulpsticks, etc.). Examples would be a sawmill or pulp mill. A "secondary" wood-using mill uses value-added products from primary wood-using mill. Examples would be paper mills or furniture plants. There can be several secondary mill links in a wood product "food chain". Some mills are very large, such as those that manufacture Oriented Stand Board (OSB), dimension lumber, particle board, and pulp and paper mills. They employ thousands of workers and consume large volumes of wood each year. However, most mills are smaller, employing fewer workers per mill. |
|
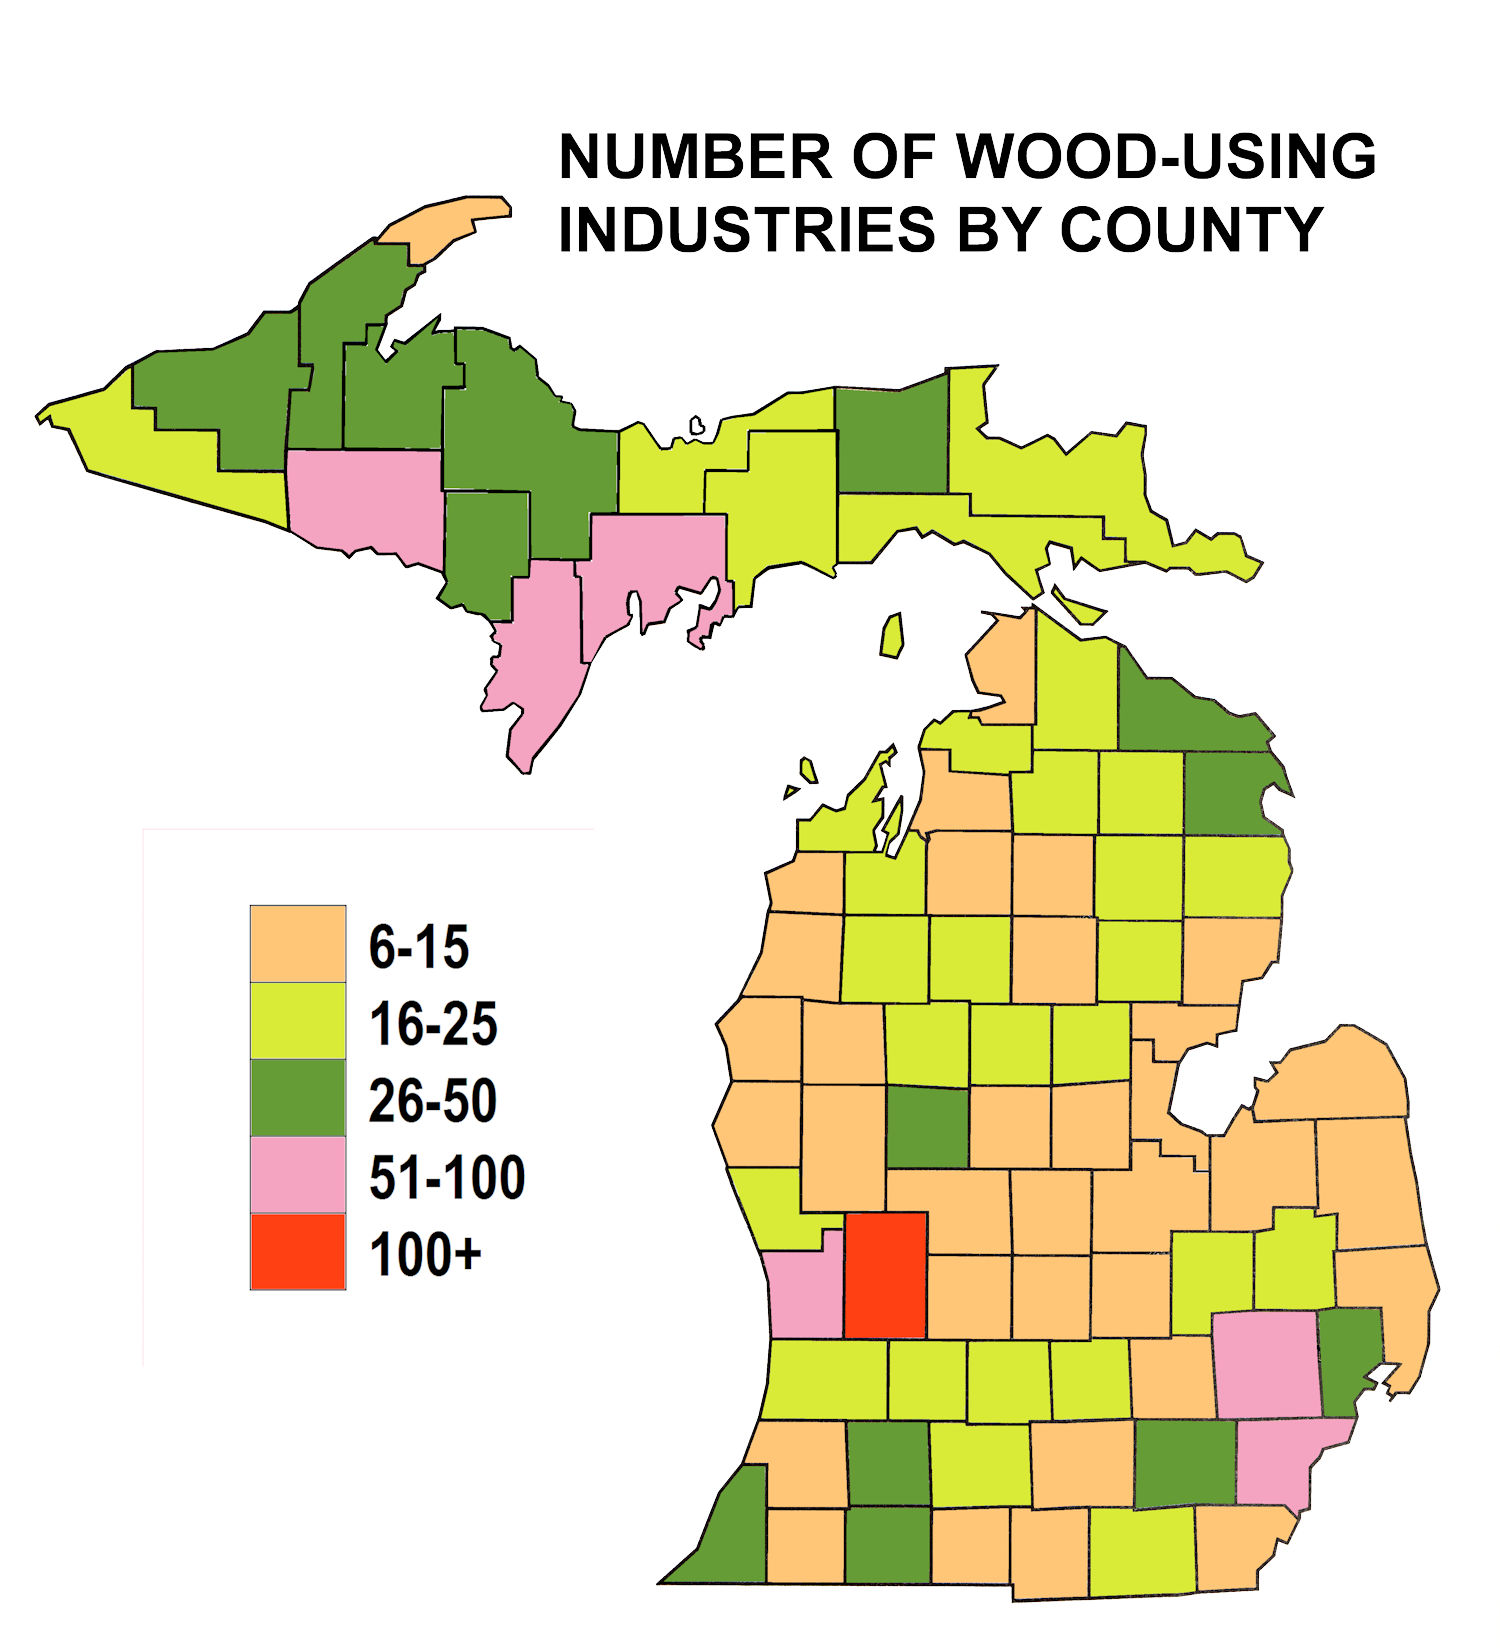 Most mills are located in southern Michigan. Most
of the state wood producers (loggers, truckers) are located in the
north close to where most of the forest resource grows. Wood materials must be
transported to these mills. Over half of Michigan's forest industry is
involved with producing the raw wood products. The furniture industry is a large
part of the picture.
Most mills are located in southern Michigan. Most
of the state wood producers (loggers, truckers) are located in the
north close to where most of the forest resource grows. Wood materials must be
transported to these mills. Over half of Michigan's forest industry is
involved with producing the raw wood products. The furniture industry is a large
part of the picture. 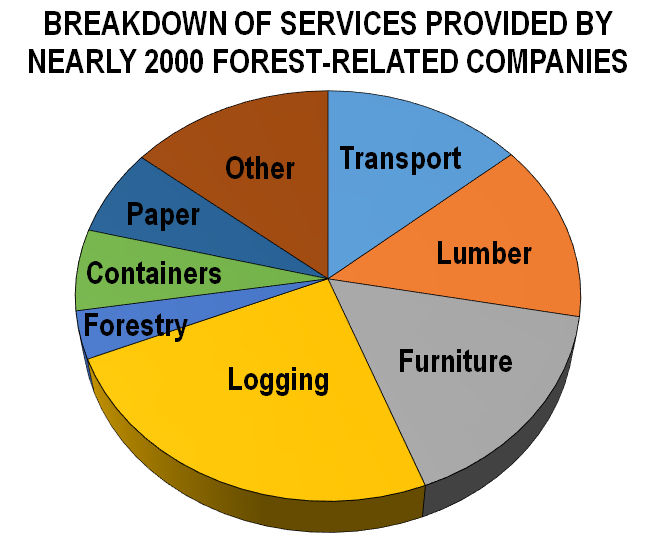
In many rural counties, forest industry is a critical element in the local economies. Over 500 million dollars flows into smaller northern towns just from the sale of logs and other raw wood products. Statewide, value-added industries contribute another 6-7 billion dollars on an annual basis. The total annual contributions of the forest industry runs about $20 billion.
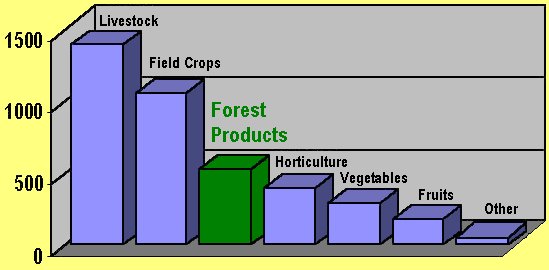
The pie chart on the right shows different services provided by Michigan's forest industry companies. Some companies do more than one thing and would then appear more than once in the count. The large "Other" category includes an incredible array of different forest products. It some ways, it's the most interesting piece of the pie, including artisans, fencing, mulch, cutting boards, slats for blinds, toys, and so much more! .
| The Michigan DNR maintains a directory of loggers, truckers, wood brokers,and wood-using industries in Michigan. Click here to leave this website and view the "Michigan Forest Products Industry" database. |
   |
| WOOD
PRODUCTION IN THE LAKE STATES
Compared to Wisconsin and Minnesota, Michigan forests harvest less wood per acre. This is part of the reason why Michigan's timber "surplus" is one of the highest in the nation. The thought might be that we manage and harvest our forests less intensively than our sister states. However, there are other possible explanations for this ranking. Michigan also has a different composition of forest types. Further west, average annual rainfall drops off and forest composition changes. Wildfire had an increasingly larger role in forest ecology closer to the Great Plains, affecting forest composition. Uneven-aged forest types, such as northern hardwoods (maple-beech-yellow birch), occupy larger proportions of Michigan's forest scape than in Wisconsin or Minnesota. These types are typically thinned on a regular basis rather than clearcut. Thinning and selection harvesting produce less wood volume per acre within the time frame of a decade or so. This is especially true of our largely middle-aged northern hardwoods being managed to create uneven-aged stands from even-aged stands left over from past logging practices. Even-aged forest types, such as aspen, red pine, jack pine, oak-hickory, and paper birch, become more frequent as you move west. Even-aged types tend to mature and decline in widespread "boom and bust" cycles. So, when the "boom" comes, harvest is accelerated to minimize the "bust". This boom-and-bust cycle has also been accentuated by our logging history and subsequent treatment of the land. Much of our Lake States aspen, paper birch, and jack pine resources have reached maturity.
|
|
||||||||||||||||||||||||||||
 |
This website was developed and created by Michigan State University Extension for the teachers of the State of Michigan. |
Page Name:
Products/Economics.htm