Home Page |
MICHIGAN FORESTS FOREVER TEACHERS GUIDE
| U.S. FOREST FACTS AND HISTORICAL TRENDS |
 |
Source: Forest Service PDF (2014) and 2001 PDF.
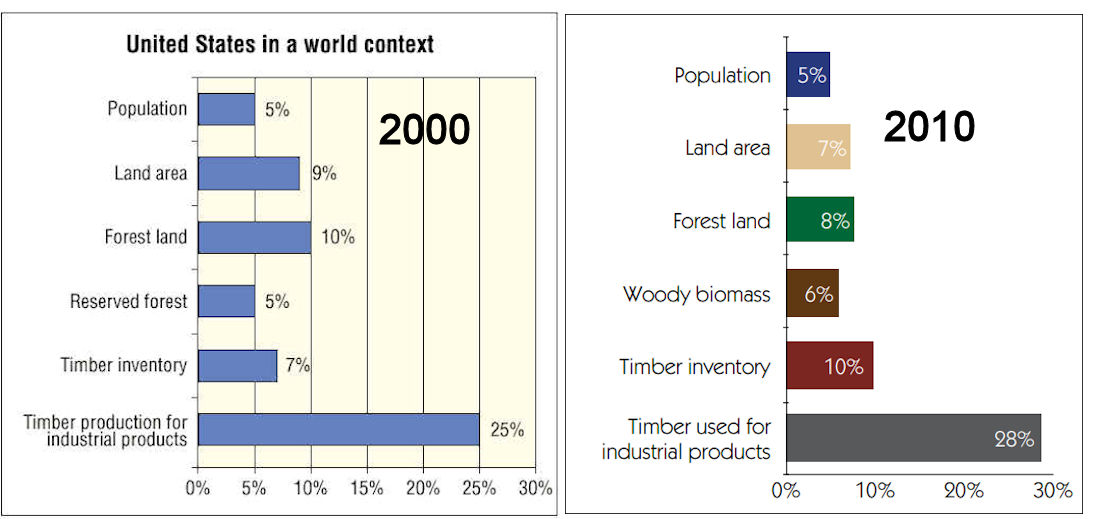
| Introduction
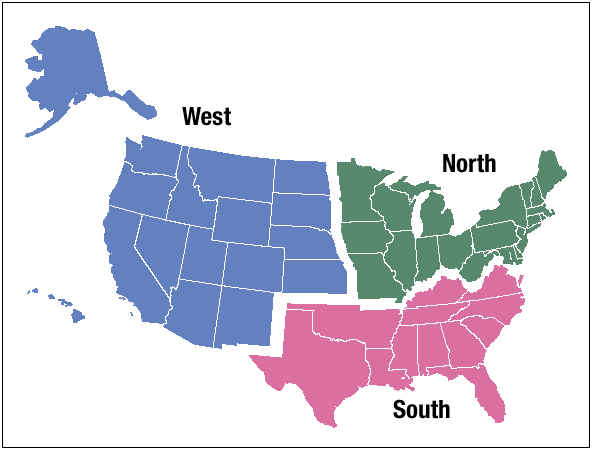
The 2015 Renewable Resources Planning Act Assessment (2010 RPA Assessment) is the sixth assessment prepared in response to the mandate in the Forest and Rangeland Renewable Resources Planning Act of 1974, P.L. 93-378, 88 Stat. 475, as amended (RPA). The 2015 RPA Assessment consists of a summary report and supporting documents. Renewable resources in this assessment include outdoor recreation, fish and wildlife, wilderness, timber, water, range, and minerals. In addition, and for the first time, there is an assessment of the urban forest resource. Data presented in this brochure highlight the findings of the 2015 RPA assessment regarding forest resource statistics: reserved forest land, timber land, forest landownership, forest composition, mortality, growth and removals, tree planting, products made from timber, and urban influences on forest land area. Regional data are reported geographically as North, South, and West. This webpage contains information from both the 2000, 2010, and 2015 assessments, for comparison. Forest Inventory Various attributes of the forest resource are inventoried by the U.S. Department of Agriculture Forest Service (USDA Forest Service) Forest Inventory and Analysis (FIA) Program and reported in the RPA Assessment and various supporting documents. To provide timely, scientifically reliable estimates of the status, condition, and trends of the Nation’s forests, the FIA has conducted field inventories for more than 80 years using state-of-the-art technology. These inventories have provided critical information in the development and implementation of policies and practices that support sustainable forestry in the United States. Seven national reports based on FIA data have been produced since 1953. In 1999, the USDA adopted an annual update protocol. The annual updates for Michigan can be found at https://www.fs.usda.gov/treesearch and by typing-in "Forests of Michigan, 20xx". |
|
Extensive field measurement from FIA inventories include over:
• 4.5 million remote sensing plots interpreted for land use
• 125,000 permanent field plots systematically located across all forest lands in the United States
• 100 characteristics measured at each plot location
• 1.5 million trees measured to evaluate volume, condition, and vigor
Additional information about FIA may be found at https://www.fia.fs.fed.us/tools-data/.
Most of the graphics have a larger version and, sometimes, additional graphics available by clicking on the image.
Land and Forest Area
It is estimated that at the beginning of European settlement in 1630, the area of forest land that would become the United States was 1,045 million acres or about 46 percent of the total land area. By 1907, the area of forest land had declined to an estimated 759 million acres or 34 percent of the total land area. Forest area has been relatively stable since 1907. In 2017, 765 million acres or 34 percent of the total land area of the United States was in forest land. Today’s forest land area amounts to about 73 percent of the area that was forested in 1630. Since 1630, about 297 million acres of forest land have been converted to other uses mainly agricultural. More than 75 percent of the net conversion to other uses occurred in the 19th century.
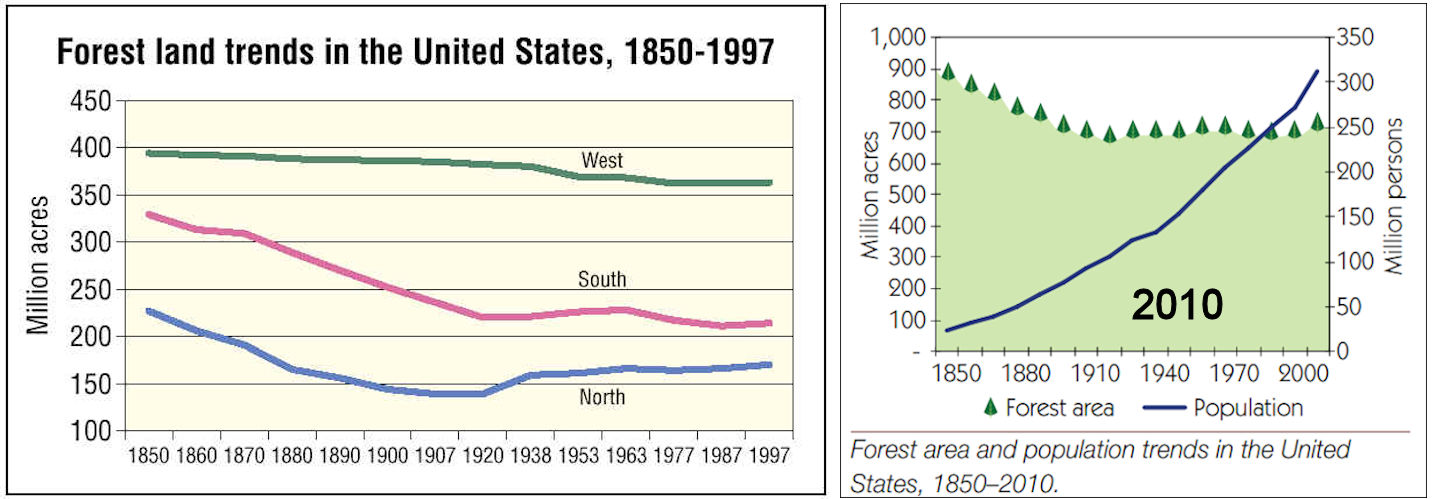 |
Stability, however, does not mean that there has been no change in forest land area. There have been shifts from agriculture to forests and vice versa. Some forest land has been converted to more intensive uses, such as urban uses. Even on areas where forest land has remained stable, there have been changes as forests respond to human manipulation, aging, and other natural processes. The effects of these changes are reflected in the information presented in webpage. |
Land
and forest area trends in the United States |
|||||
| Category | Year | U.S. | North | South | West |
| Land | 2012 | 2,261 | 413 | 533 | 1,315 |
| Of which: Forest |
2012 2007 1997 1987 1977 1963 1953 1940 (1938) 1920 (1907) (1630) |
766 |
176 172 170 (170) 165 (166) 164 (164) 166 (166) 161 (161) 159 (159) 149 (139) (298) |
245 235 231 (214) 234 (211) 235 (217) 245 (228) 240 (226) 232 (221) 220 (236) (354) |
346 346 341 (363) 333 (362) 343 (362) 342 (368) 341 (369) 346 (380) 353 (385) (394) |
| Of which: Timber land |
2012 |
521 514 504 (504) 485 (486) 491 (492) 515 (515) 509 (509) 502 482 |
167 164 159 (159) 155 (154) 153 (153) 156 (157) 154 (154) 149 138 |
210 204 201 (201) 195 (197) 198 (200) 209 (209) 205 (205) 200 194 |
144 146 143 (143) 135 (135) 139 (139) 150 (150) 150 (150) 153 149 |
| Reserved forest |
2012 2007 1997 1987 1977 1963 1953 1940 1920 |
74 75 52 (52) 35 (48) 29 (35) 25 (27) 24 (26) 11 10 |
7 |
4 |
63 65 40 (40) 25 (37) 21 (27) 19 (22) 19 (21) 6 6 |
| Other forest |
2012 2007 1997 1987 1977 1963 1953 1940 1920 |
187 |
17 2 3 (3) 4 (3) 5 (5) 5 (5) 3 (3) 6 7 |
31 7 9 (9) 13 (11) 17 (15) 18 (18) 20 (20) 21 18 |
139 134 157 (179) 173 (191) 182 (196) 173 (196) 172 (198) 187 197 |
| In addition to the land area of the United States at that time, estimates for 1938 include forest area in the regions that would become the States of Alaska and Hawaii. Estimates for 1907 also include forest area in the regions that would become the States of Alaska, Arizona, Hawaii, and New Mexico. Estimates for 1630 represent the forest area in North America for regions that would become the 50 States within the current United States. Source for 1938: U.S. Congress (1941). Source for 1907 and 1630: R.S. Kellogg (1909). | |||||
| Reserved Forest Land
Reserved forest land has doubled since 1953 and now stands at 10 percent of all forest land in the United States. This reserved forest area includes State and Federal parks and wilderness areas but does not include conservation easements, areas protected by non-governmental organizations, and most urban and community parks and reserves. Significant additions to Federal forest reserves occurred since the passage of the Wilderness Act in 1964. |
 |
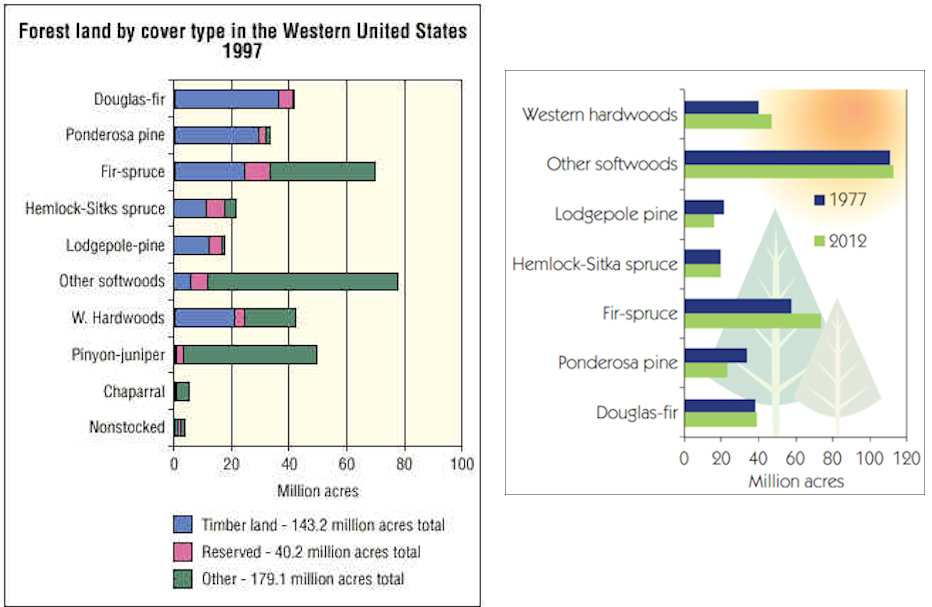
| Timberland and Other Forestland
Timberland is fairly evenly distributed among the three major regions of the United States. Other forestland, such as slow-growing forests of spruce in interior Alaska and pinyon-juniper in the interior West, dominate many western landscapes and comprise more than one-fourth of all U.S. forest land. Timberland is forest that can grow 20 cubic feet of wood per acre per year, and harvest is not excluded by administrative rule. |
 |
Ownership of Forest Land
Ownership of forest land
by region and land class, 2012 & 1997 (million acres) (1997 acres in red, changes largely definitioinal) |
||||
| Owner class/ land class |
U.S. |
North |
South |
West |
| National forest Timberland Reserved forest Other forest |
145 (147) 98 (96) 27 (28) 20 (23) |
12 (12) 10 (10) 1 (1) 0 (0) |
13 (12) 12 (11) 1 (1) 0 (0) |
120 (123) 75 (75) 24 (25) 20 (22) |
| Other public Timberland Reserved forest Other forest |
176 (170) 63 (50) 47 (23) 67 (97) |
35 (30) 29 (22) 5 (6) 0 (1) |
20 (13) 15 (10) 3 (3) 2 (1) |
122 (127) 19 (17) 39 (14) 65 (95) |
| Corporations Timberland Reserved forest Other forest |
147 (68) 111 (67) 0 (0) 48 (1) |
29 (15) 29 (15) - (0) 0 (0) |
65 (37) 61 (37) 0 (0) 4 (0) |
53 (16) 21 (15) 0 ( -) 32 (1) |
| Other private Timberland Reserved forest Other forest |
298 (363) 249 (291) 0 (1) 48 (71) |
100 (114) 99 (112) 0 (0) 1 (2) |
147 (152) 121 (143) 0 (0) 25 (8) |
51 (97) 28 (35) 0 (1) 22 (61) |
| All owners Timberland Reserved forest Other forest |
766 (747) 521 (504) 74 (52) 172 (191) |
176 (170) 167 (159) 7 (8) 2 (3) |
244 (214) 210 (201) 4 (4) 31 (9) |
346 (363) 144 (143) 63 (40) 139 (179) |
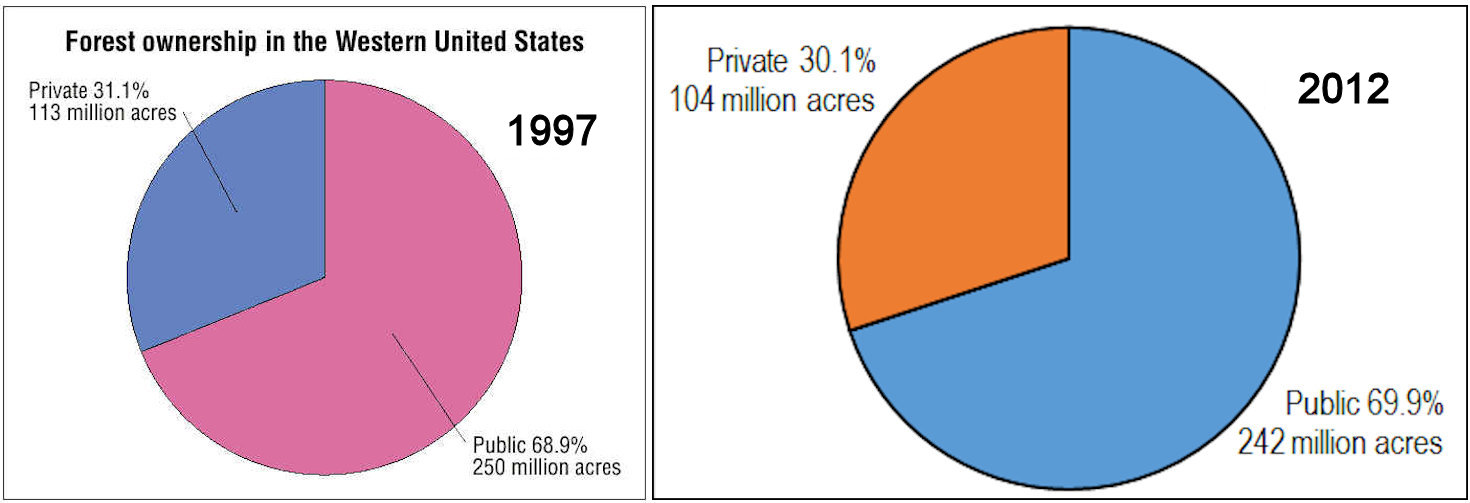
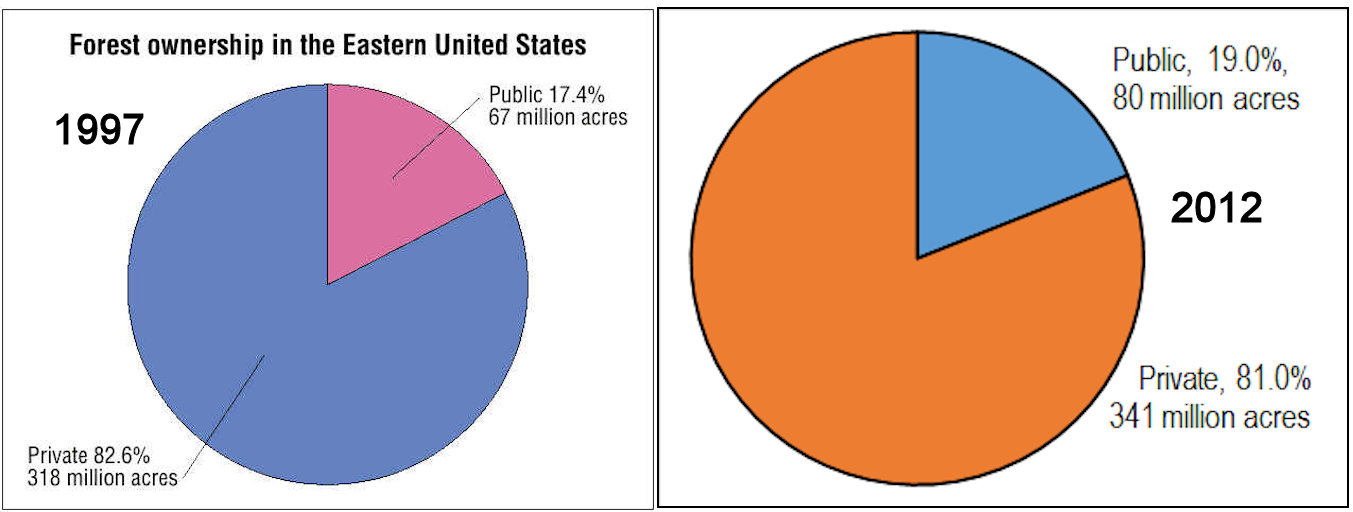
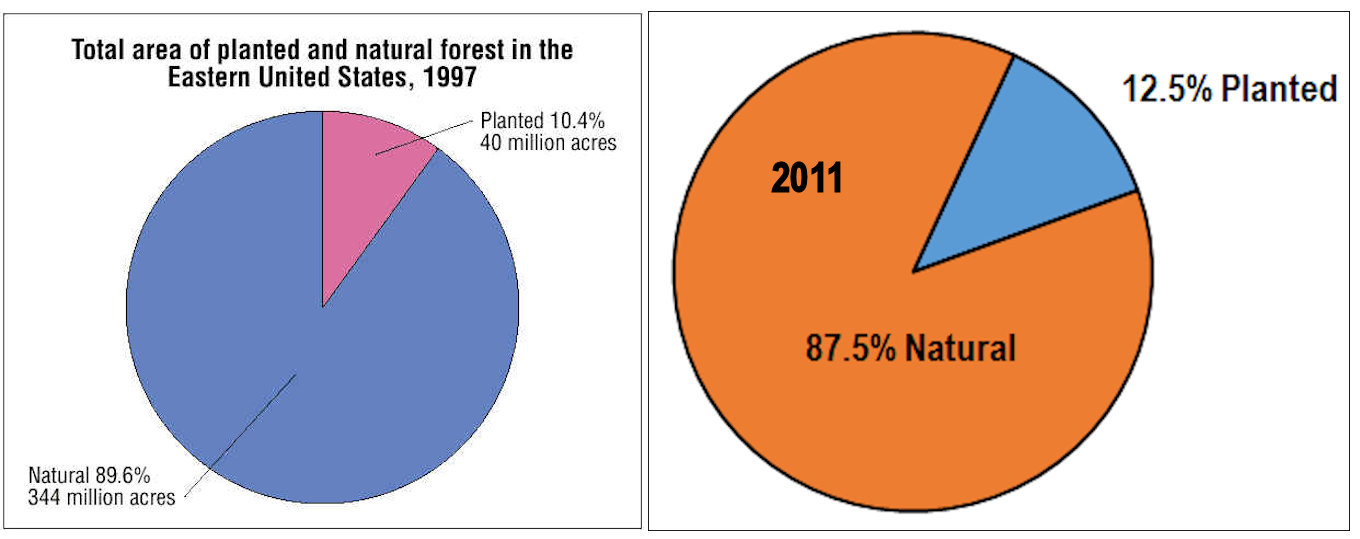
East vs. West The ownership of
forestland in the United States varies from East to West. While private forestland
predominates in the East, public ownership is predominant in the West. However, the eastern U.S. has more forest area and volume than the west. Clicking on the images below will show pie charts for 1997 and 2012. |
|
|
|
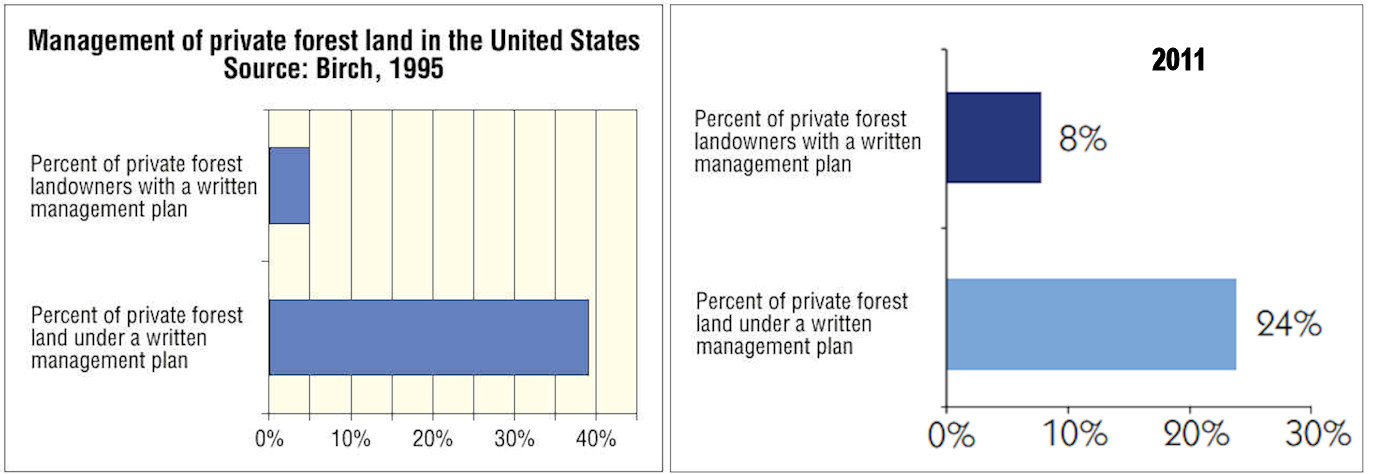
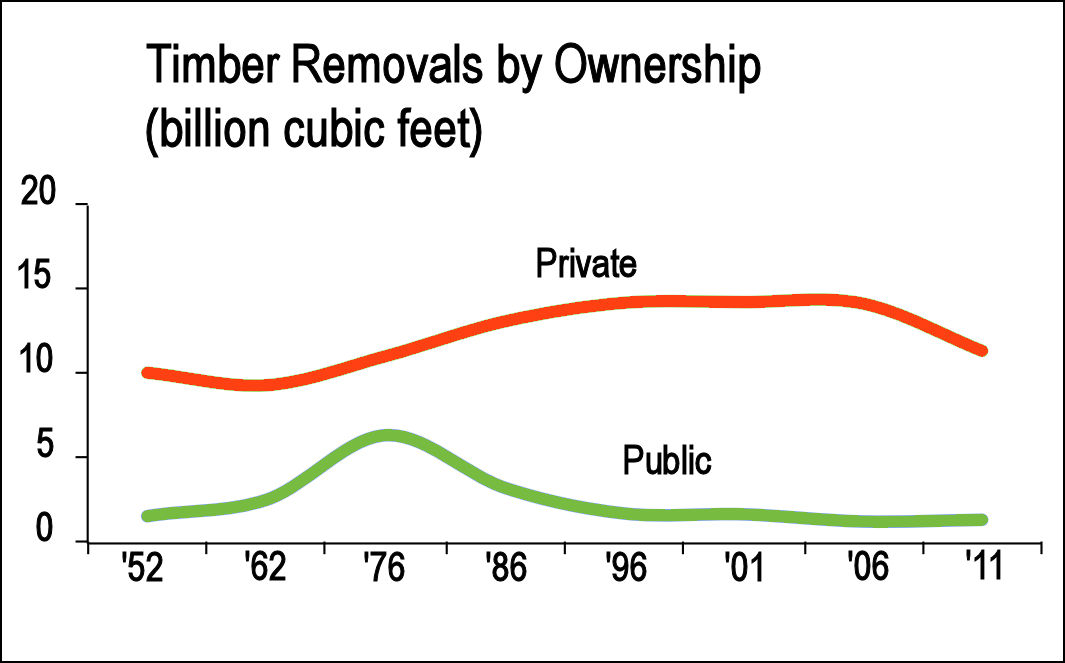
| Public vs. Private Management Activity
As timber production shifts from public to private land, there is an increasing need to have information on the management objectives of the private forestowners. This information is critical to developing policies promoting sustainable forestry in the United States. Recent studies have shown that only 8 percent of the private forest landowners in the United States have a written management plan. However, these plans cover 24 percent of the private forest area in the United States. Private forests provided 89 percent of the Nation’s timber harvest in 2016. |
  |
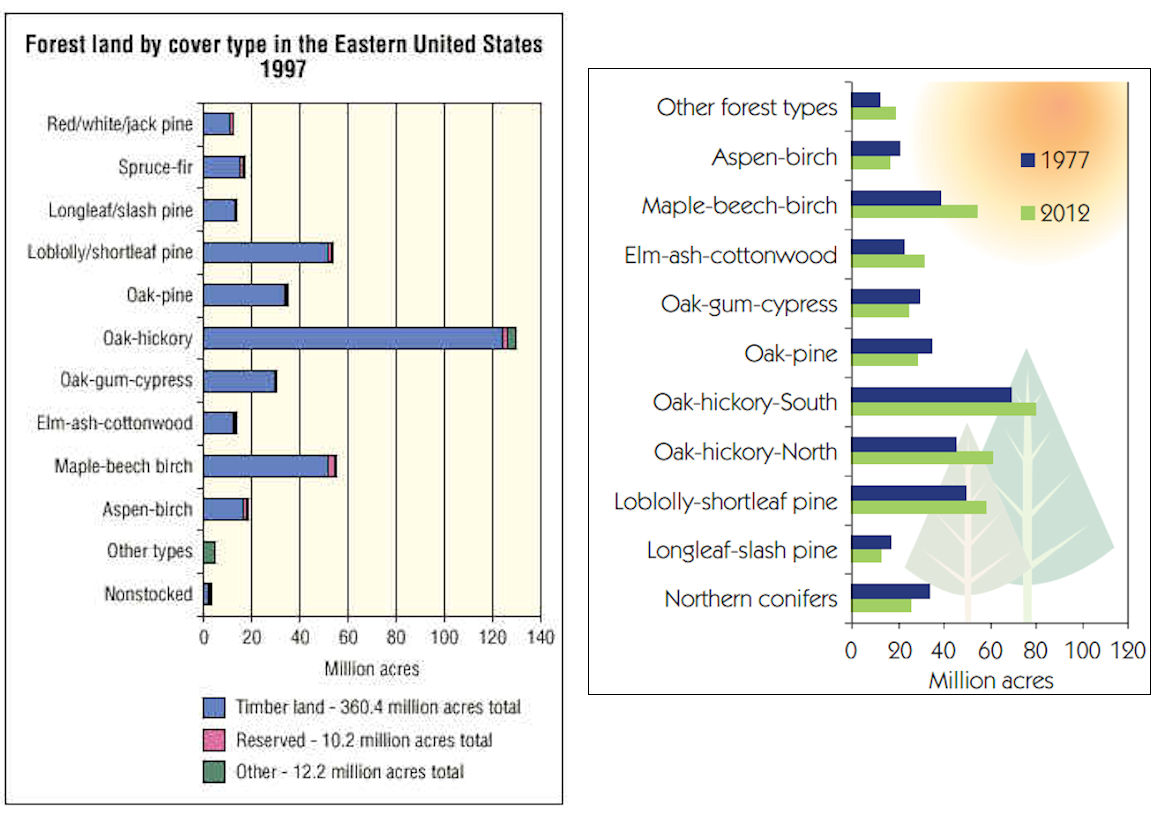
Forest Composition
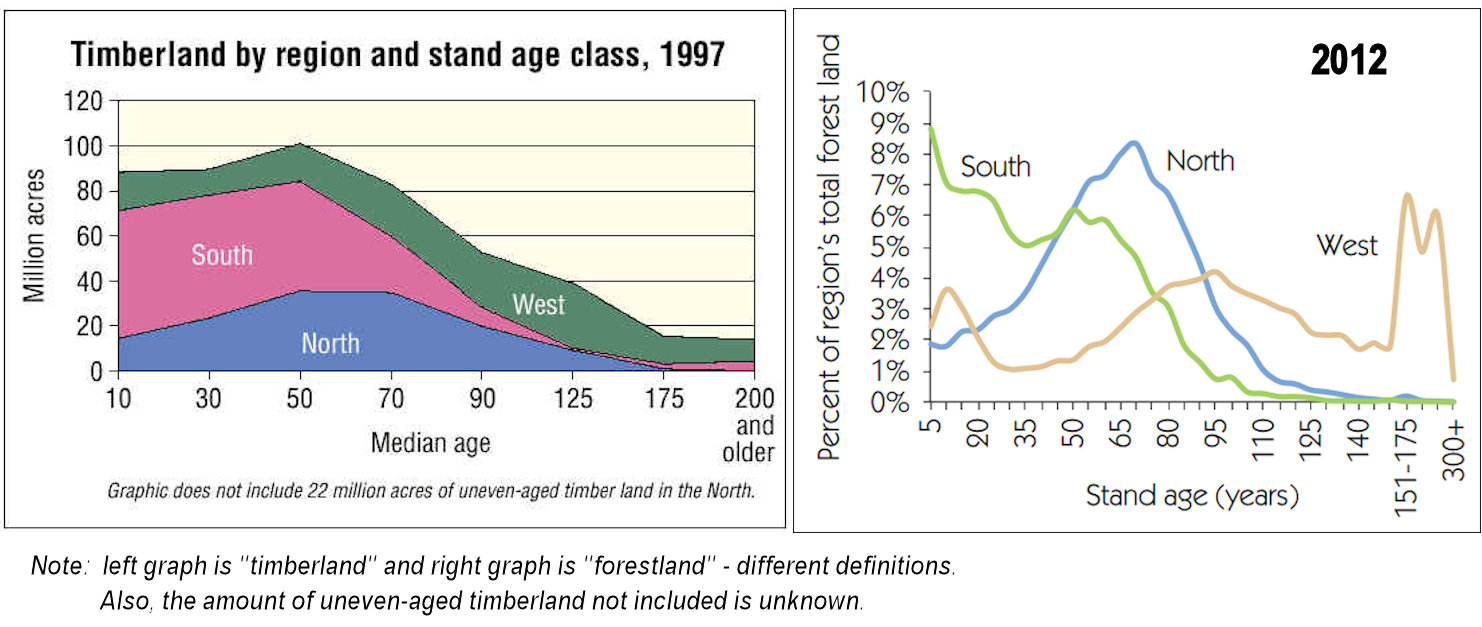
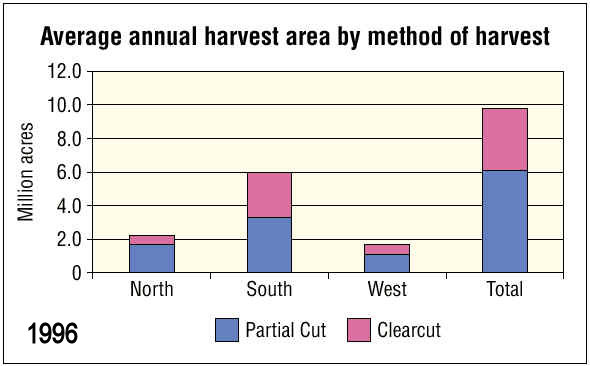
| Stand Age and Average Annual Harvest Area After intensive logging in the late 19th century and early 20th century, 55 percent of the forests on the Nation’ s timberland is less than 50 years old. Six percent of the Nation’s timberland is more than 175 years old. [Large areas of old forest are in designated reserves and are not depicted in the timber land graphic shown.] It is also notable that much of the Nation's multi-aged and all-aged forest lies in the North, and these acres are not included in the "stand age" data, as there is not discrete stand age origin. |
 |
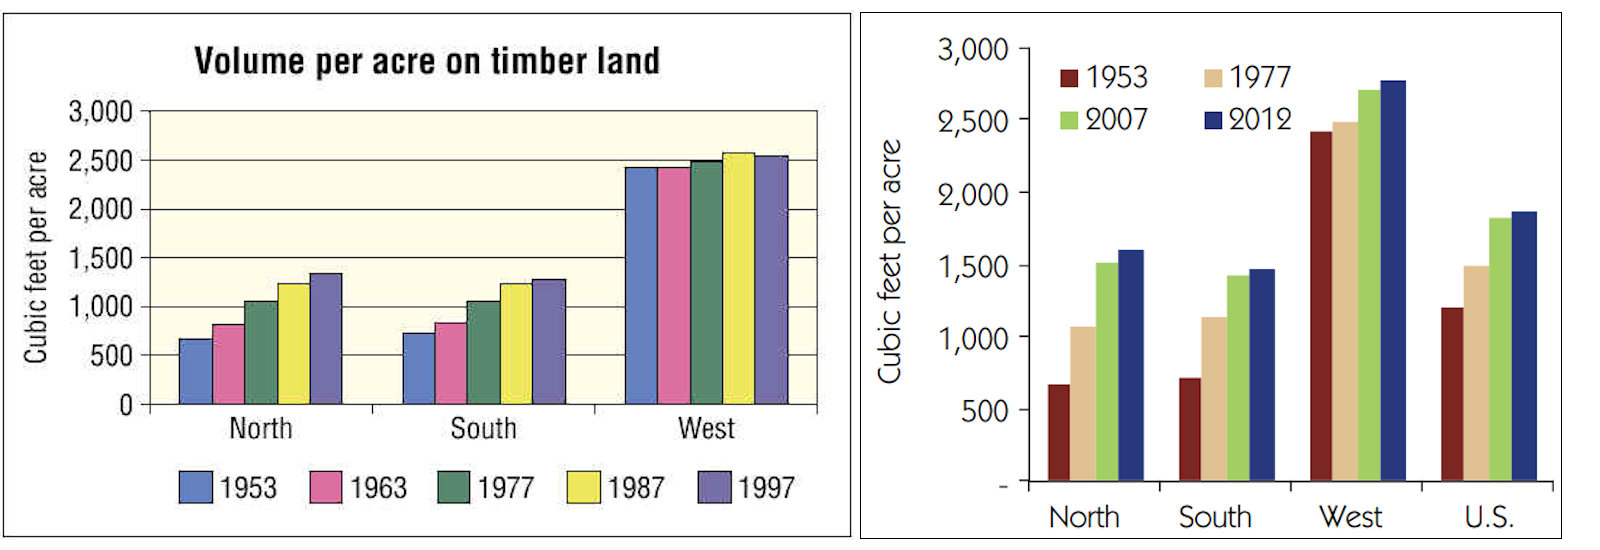
| Growing Stock Volume Average growing stock volume per acre on timberland continues to rise across the United States. The rate of increase has leveled off, partially due to recent increases in mortality. In the North Region, mortality has now caught-up and exceeded removals (moslty the same as harvest). |
 |
| Growing stock inventory, growth, removals, and mortality on timber land by region and species group in the United States, 1952-2012 (billion cubic feet) | |||||
| Volume category | Year | U.S. | North | South | West |
| All species Inventory Growth Mortality |
2011 2011 2011 |
972.4 932.1 835.7 781.7 733.1 665.6 615.9 26.4 12.9 11.3 |
267.8 248.0 214.3 190.0 163.0 128.3 103.7 6.5 2.4 2.5 |
306.6 288.5 256.4 244.6 223.4 174.1 148.5 13.8 8.1 5.1 |
398.0 395.6 365.1 347.0 346.7 363.2 363.7 6.1 2.5 3.7 |
| Softwoods Inventory Growth Removals Mortality |
2012 2007 1997 1987 1977 1963 1953 2011 2011 2011 |
547.6 529.2 483.9 467.6 467.0 449.8 431.8 15.7 8.3 5.2 |
58.8 55.9 49.4 47.6 43.9 33.7 27.1 1.5 0.6 0.6 |
129.0 118.5 104.8 105.6 101.2 75.1 60.5 8.8 5.3 1.3 |
360.0 354.9 329.6 314.3 321.9 341.0 344.3 5.3 2.3 3.4 |
| Hardwoods Inventory Growth Removals Mortality |
2012 2007 1997 1987 1977 1963 1953 2011 2011 2011 |
424.8 402.9 351.8 314.1 266.1 215.8 184.1 10.6 4.5 6.1 |
209.0 192.1 164.9 142.4 119.2 94.6 76.7 5.0 1.7 1.9 |
177.7 170.0 151.5 139.0 122.2 99.0 88.0 5.0 2.7 3.9 |
38.1 40.7 35.4 32.6 24.8 22.2 19.4 0.7 0.1 0.3 |
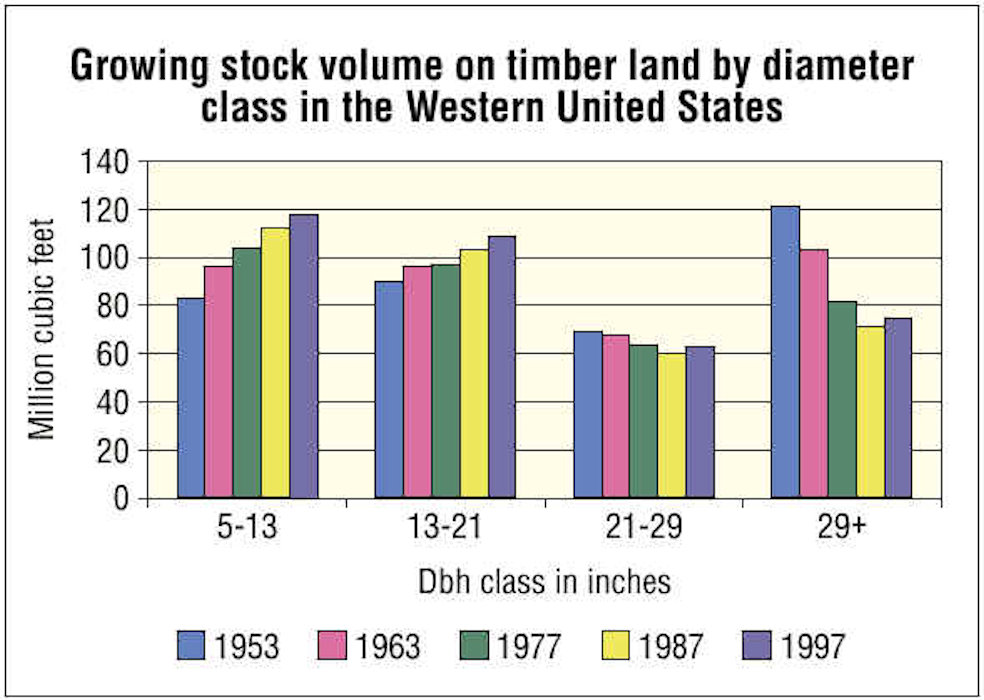
| The average volume, and the number of trees, on timberland in the United States continues to increase in most diameter classes. A slight decline in the 5- to 13-inch class in the East is expected to stabilize as trees planted on millions of Conservation Reserve Program acres in the South reach this size. The decline in the 29-plus-inch class on timberland in the West is, in part, due to setting aside timberland into legal reserves in the 1970’s. Although they are not harvested, these set-asides "remove" the trees from the timberland base. Recent increases in larger trees are due to policy shifts in the West that have curtailed harvesting of stands with larger trees. |
   |
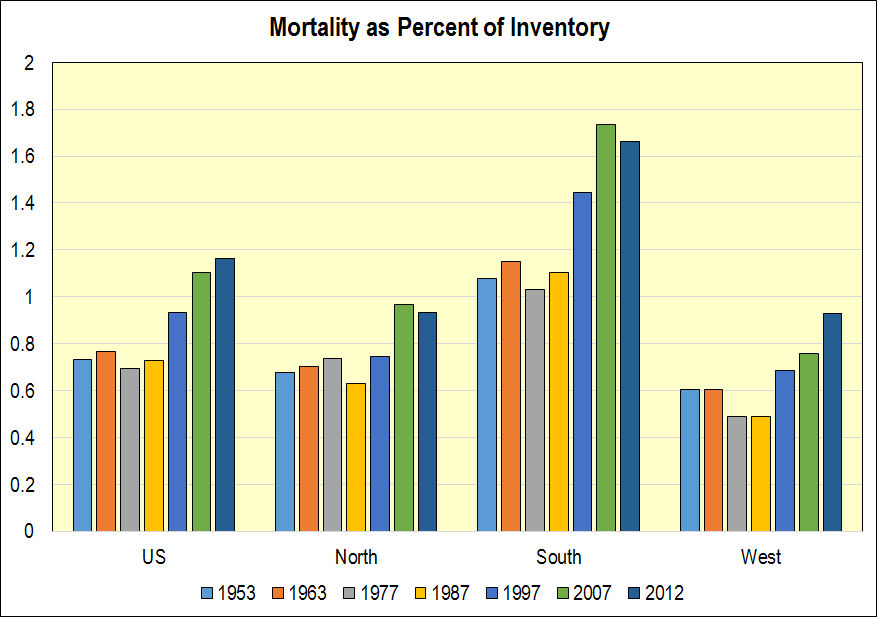
| Tree Mortality Tree mortality relative to standing inventory has fluctuated over the years and is currently at the highest level in 50 years. However, while current rates are high, much of the increase may be due to local effects. It is difficult to discern if they are beyond the range of normal variability from a national perspective. |
 |
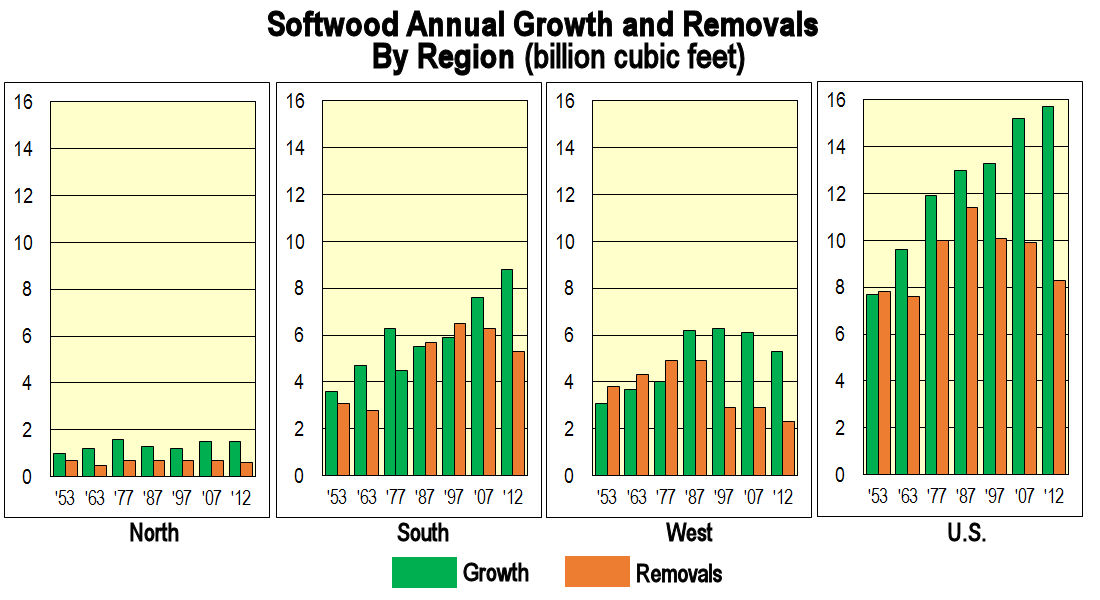
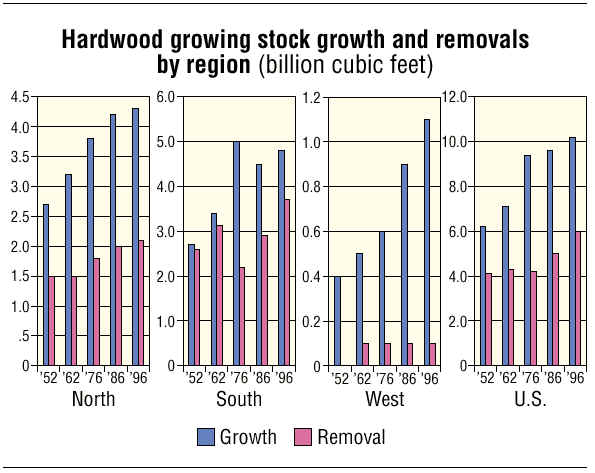
| Growing Stock Growth and Removals Over the past 50 years, growth has generally exceeded removals throughout the United States. While harvest levels have leveled off in recent years, there has been a decided shift from public land in the West to private land in the East. In 1996, softwood removals in the South exceeded growth for the first time since 1952, when national inventory data first became available. |
  |
|
According to recent FIA reports, harvesting in the United States is approximately 61 percent selective or partial harvest and 39 percent clearcutting, over around 11 million acres per year. This especially true for the Lake States, where the northern hardwood forest type predominates. These proportions have been steady since the 1990s. |
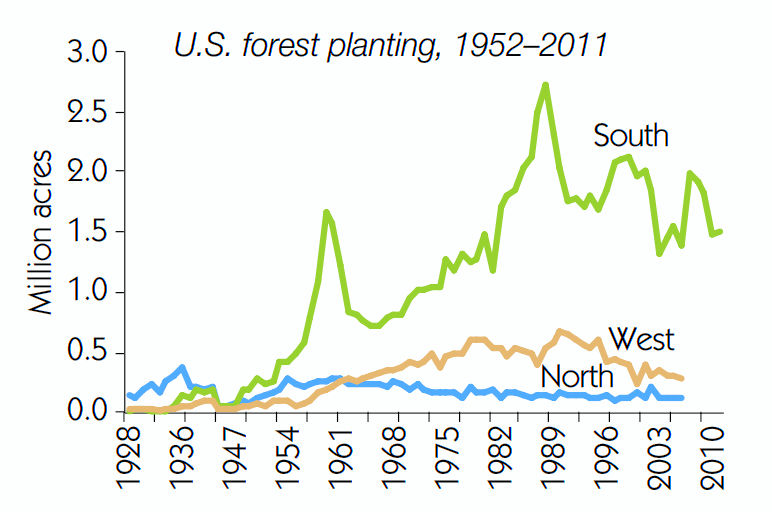
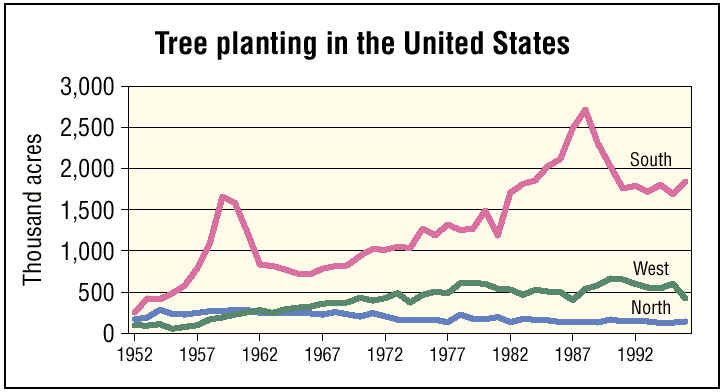
Tree Planting
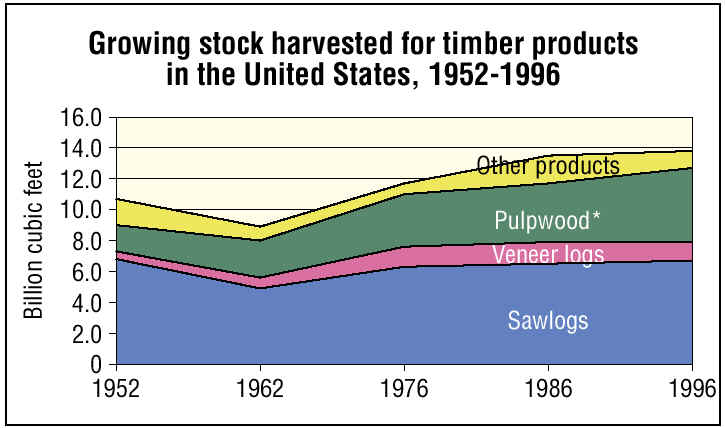
Timber Products
|
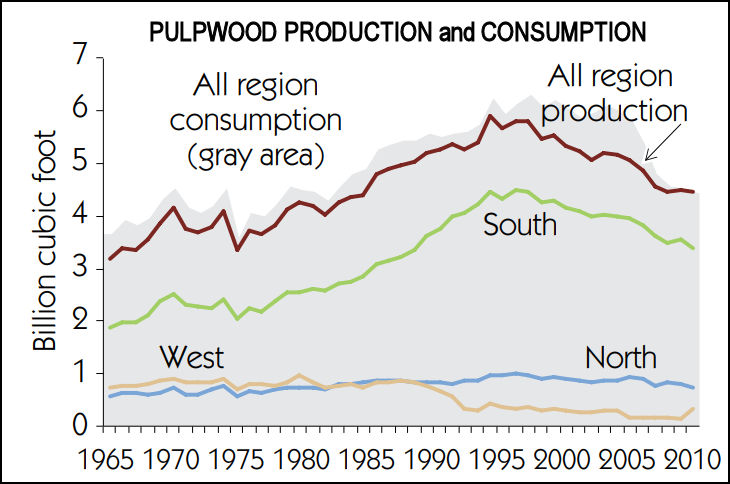
While most timber products harvested from U.S. forests have been increasing since 1976, the greatest gains have been in fiber for pulp and composite products. Much of this increase has been in hardwoods as new technologies improve utilization of these species.
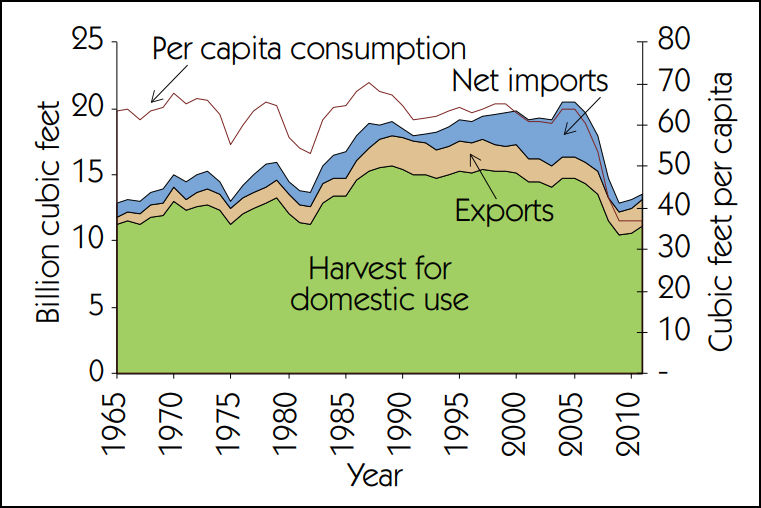
Total and per capita roundwood consumption, by category, 1965–2011. The recession of 2008 crashed the market for many wood products. The industry has not recovered from that drop in demand.
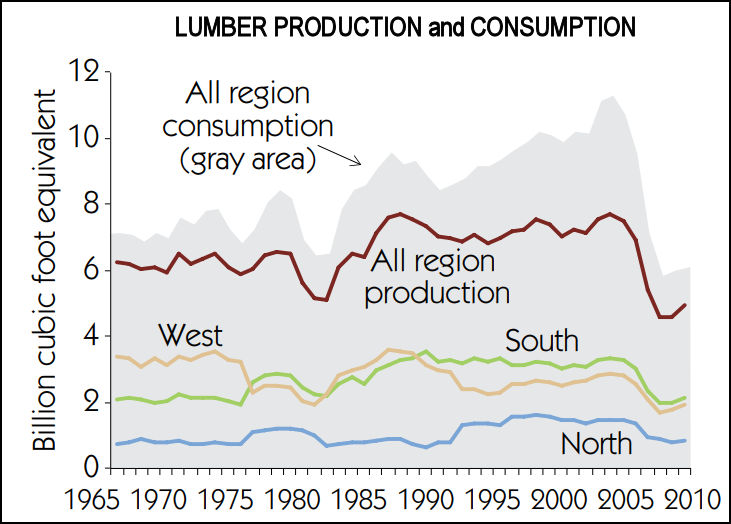
Pulpwood and lumber production (below) reflect that same trend. Lumber still shows net imports, mostly from Canada. |
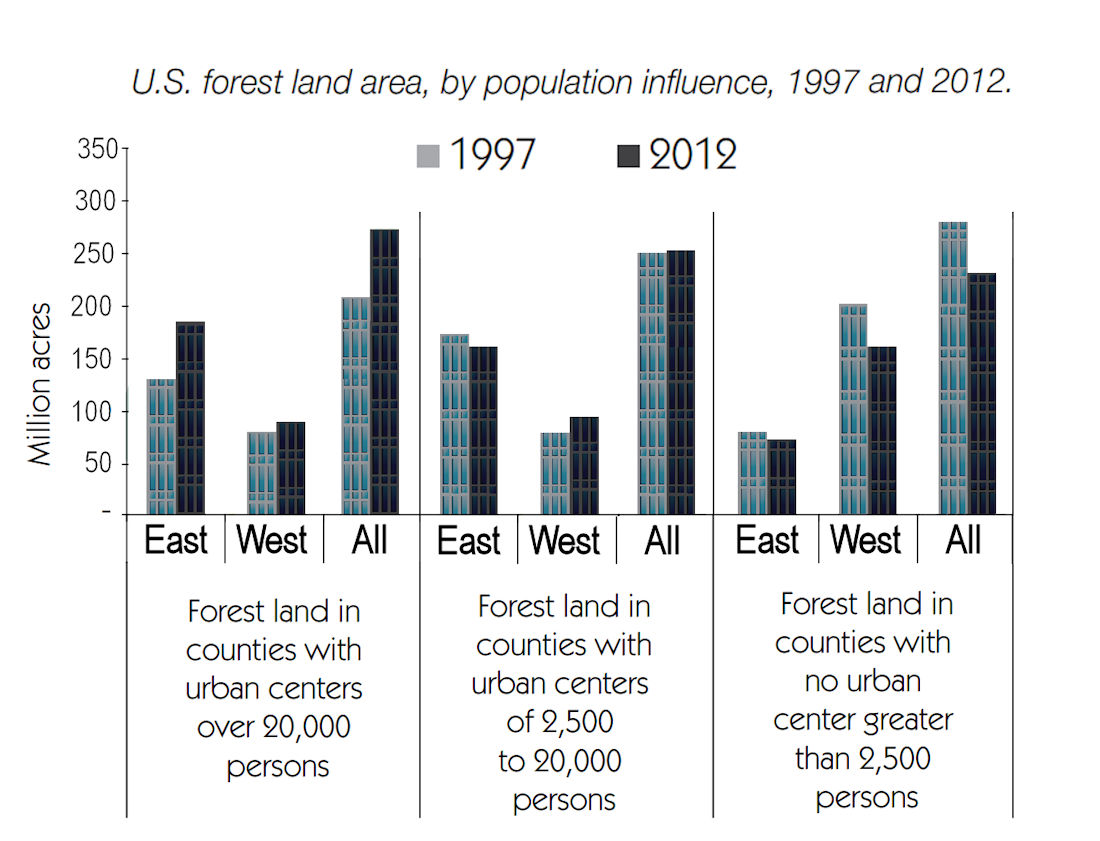
Urban Influence on U.S. Forests
Conclusion
This webpage presents some trends and highlights regarding the forest resource of the United States. The supporting documents for this webpage are Forest Service PDF (2014) and 2001 PDF.
Terms
| Forest land Land that is at least 10 percent stocked by forest trees of any size, including land that formerly had tree cover and that will be naturally or artificially regenerated. The minimum area for classification of forest land is 1 acre. Growing stock volume Live trees of commercial species meeting specified standards of quality and vigor. Cull trees are excluded. Includes only trees 5 inches in diameter or larger at 4.5 feet above ground. Growth (Net Annual) The net increase in the volume of growing stock trees during a specified year. Components include the increment in net volume of trees at the beginning of the specific year that survive to the end of the year, plus the net volume of trees reaching the minimum size class during the year, minus the volume of trees that died during the year, and minus the net volume of trees that became cull trees during the year. Hardwood A dicotyledonous tree, usually broad-leaved and deciduous. Logging residues The unused portions of growing-stock trees cut or killed by logging and left in the woods. Mortality The volume of sound wood in growing stock trees that died from natural causes during a specified year. National forest An ownership class of Federal lands, designated by Executive Order or statute as a national forest or purchase unit, under the administration of the Forest Service. Other Federal An ownership class of Federal lands other than those administered by the Forest Service. Primarily lands owned by the Bureau of Land Management, National Park Service, U.S. Fish and Wildlife Service, and the Departments of Energy and Defense. |
Other forest land Forest land other than timber land and productive reserved forest land. It includes available and reserved forest land, which is incapable of annually producing 20 cubic feet per acre of industrial wood under natural conditions because of adverse site conditions, such as sterile soils, dry climate, poor drainage, high elevation, steepness, or rockiness. Other removals Unutilized wood volume from cut or otherwise killed growing stock, from cultural operations such as pre-commercial thinnings, or from timber land clearing. Removals The net volume of growing stock trees removed from the inventory during a specified year by harvesting; cultural operations, such as timber stand improvement; or land clearing. Reserved forest land Forest land withdrawn from timber utilization through statute, administrative regulation, or designation. Roundwood products Logs, bolts, and other round timber generated from harvesting trees for industrial or consumer use. Softwood A coniferous tree, usually evergreen, having needles or scale-like leaves. Timber land Forest land that is capable of producing crops of industrial wood and not withdrawn from timber utilization by statute or administrative regulation. (Note: Areas qualifying as timber land are capable of producing in excess of 20 cubic feet per acre per year of industrial wood in natural stands.) |
References
Birch, Thomas W., Lewis, D.G., and Kaiser, H. 1982. The private forest-land owners of the United States. Resource Bulletin. WO-1. Washington, DC: USDA Forest Service. 64 p.
Brooks, Davis J. 1993. U.S. forest in a global context. Gen. Tech. Rep. RM-228. Fort Collins, CO: USDA Forest Service, Rocky Mountain Forest and Range Experiment Station. 24 p.
Dwyer, John F., et al. 2000. Assessing our Nation’s urban forests: Connecting people with ecosystems in the 21st century. Draft report to be published as a General Technical Report. Portland, OR: USDA Forest Service, Pacific Northwest Experiment Station.
Kellogg, R.S. 1909. The timber supply of the United States. Forest Resource Circular No. 166. Washington, DC: USDA Forest Service. 24p.
Smith, W. Brad; Vissage, John; Sheffield, Raymond; Darr, David. 2001. Forest Statistics of the United States, 1997. General Technical Report in prep. St. Paul, MN: USDA Forest Service North Central Forest Experiment Station.
U.S. Bureau of the Census. 1991. Statistical Abstract of the United States (11th edition). Washington, DC: U.S. Department of Commerce.
U.S. Congress. 1941. Forest Lands of the United States, Report of the Joint Committee on Forestry (Clapp Report). 77th Congress, 1st Session, Document No. 32, March 1941.
USDA Forest Service. 1958. Timber resource for America's future. Forest Resource Report No. 14. Washington, DC: USDA Forest Service. 713p.
USDA Forest Service. 1965. Timber trends in the United States. Forest Resource Report No. 17. Washington, DC: USDA Forest Service. 235p.
USDA Forest Service. 1982. Analysis of the timber situation in the United States, 1952-2030. Forest Resources Report No. 23. Washington, DC: USDA Forest Service. 499 p.
USDA Forest Service. 2001. U.S. Forest Resource Facts and Historical Trends. FS-696 .
https://www.fia.fs.fed.us/library/brochures/docs/2000/ForestFacts.pdf
USDA Forest Service. 2014. Eds. Oswalt, Sonja N. and W. Brad Smith. U.S. Forest Resource Facts and Historical Trends. FS-1035. https://www.fia.fs.fed.us/library/brochures/docs/2012/ForestFacts_1952-2012_English.pdf
Waddell, Karen L.; Oswald, Daniel D.; Powell, Douglas S. 1989. Forest statistics of the United States, 1987. Resource Bulletin. PNW-RB-168. Portland, OR: USDA Forest Service Pacific Northwest Research Station. 106 p. 20.
 |
This website was developed and created by Michigan State University Extension for the teachers of the State of Michigan. |
Page Name:
TreeBasics/Trends.htm

