
Home Page |
MICHIGAN FORESTS FOREVER TEACHERS GUIDE
Try to imagine all the things people use that are made from wood or have by-products from wood in them. Over 5,000 items are wood-based, at least in part, many of which we wouldn't even think of having "wood" in them. One example is the "leather" tag on your favorite pair of Levi's. That's not leather! It's specially-treated paper made in a mill in Michigan! Or, what about "paper" money. Oops, that's NOT paper from wood. It's made from cotton and linen, which are other plants, but not trees.
To see a list of several hundred products, click here. Wood by-products include such things as resins, cellulose (the main component of wood), chemicals, and other extractives. But, wood products are also added to just about anything, including concrete, plastic, food, clothing, and metals. Wood is also being more commonly used for heating, electricity, and transportation fuels. Then, there's a lot research to find new uses for this renewable raw material, from plastic botttles to car bodies.
 Each year on the average, every person uses more wood.
And, each year there are more and more people. The wood comes from the forest, just
one of many multiple uses of the forest. Every
day, the average person in the USA will consume about 4.5 pounds of wood, that's a little
over a third of a two-by-four. Over the course of a year, that adds up to a
16-18" tree, a hundred feet tall. Those trees come from the forest, of
course. Managing forests will provide more wood (and other outputs) in a shorter
period of time. Read an essay by Dr. Patrick Moore
for a remarkable perspective on forestry, environmental challenges, and trees.
Each year on the average, every person uses more wood.
And, each year there are more and more people. The wood comes from the forest, just
one of many multiple uses of the forest. Every
day, the average person in the USA will consume about 4.5 pounds of wood, that's a little
over a third of a two-by-four. Over the course of a year, that adds up to a
16-18" tree, a hundred feet tall. Those trees come from the forest, of
course. Managing forests will provide more wood (and other outputs) in a shorter
period of time. Read an essay by Dr. Patrick Moore
for a remarkable perspective on forestry, environmental challenges, and trees.
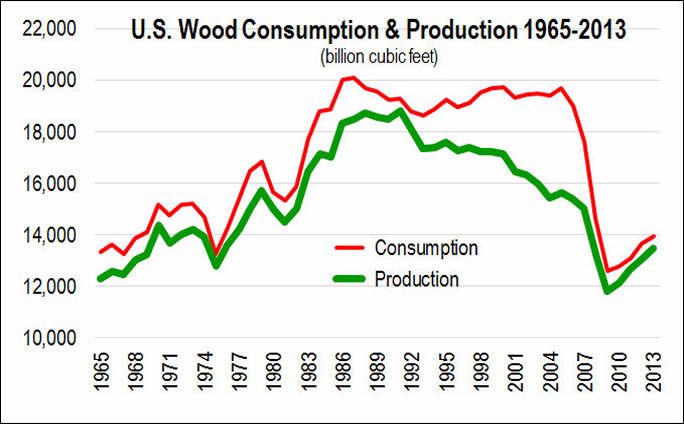
As a nation, consumption and production of wood plummeted early in the century and has only recently begun to recover. For a while, roughly 1995 to 2005, there was a wide gap between consumption and production. This gap was filled largely by wood imports.
Where does our wood come from?
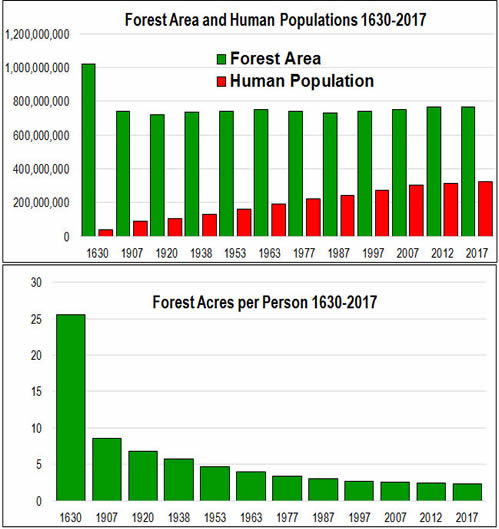 Most of our wood comes from our own country. However,
both Michigan and USA are net wood importers. That means we use more wood
than we grow. Canada is our largest wood importer, especially softwoods
(needle-bearing trees). But sometimes wood comes from countries where environmental
protection and forest management are inadequate. Some would argue that we should be
self-sufficient in wood. That is probably a good idea in that we probably could
produce the volume of wood used without negative environmental consequences.
However, some kinds of wood just don't grow in the USA. And, good forest management
is a positive economic development in other countries, as well as our own.
Most of our wood comes from our own country. However,
both Michigan and USA are net wood importers. That means we use more wood
than we grow. Canada is our largest wood importer, especially softwoods
(needle-bearing trees). But sometimes wood comes from countries where environmental
protection and forest management are inadequate. Some would argue that we should be
self-sufficient in wood. That is probably a good idea in that we probably could
produce the volume of wood used without negative environmental consequences.
However, some kinds of wood just don't grow in the USA. And, good forest management
is a positive economic development in other countries, as well as our own.
How much wood do we harvest in Michigan?
 A lot. About 400 million cubic feet in 2017, and the
amount has been fluctuated over the decades. But how much is that?
A lot. About 400 million cubic feet in 2017, and the
amount has been fluctuated over the decades. But how much is that?
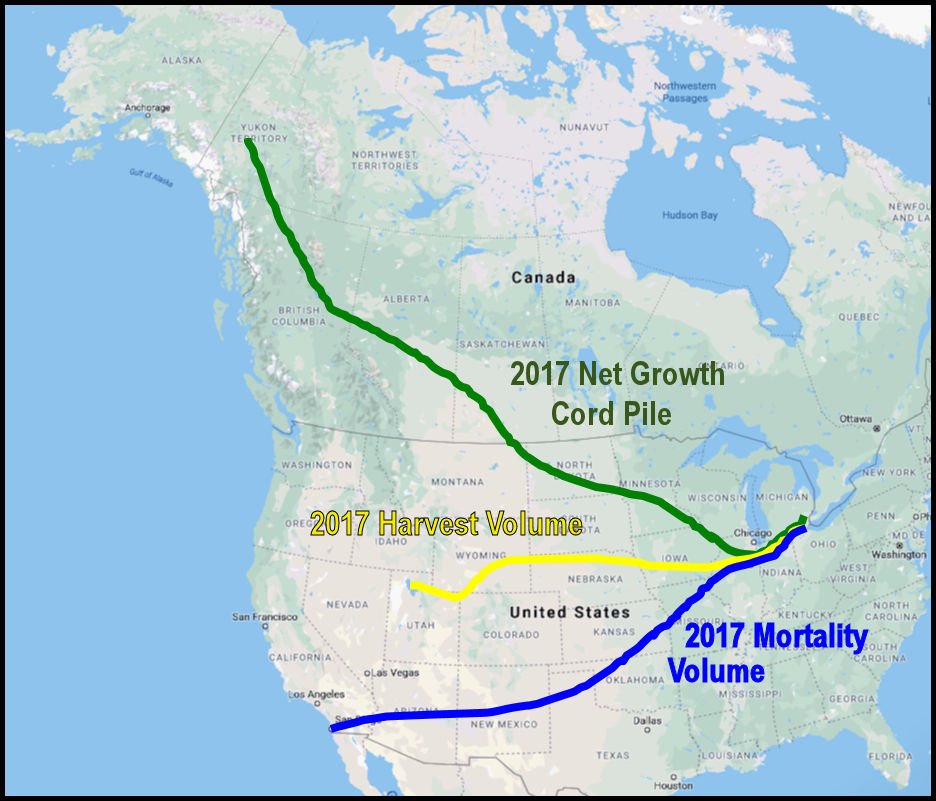
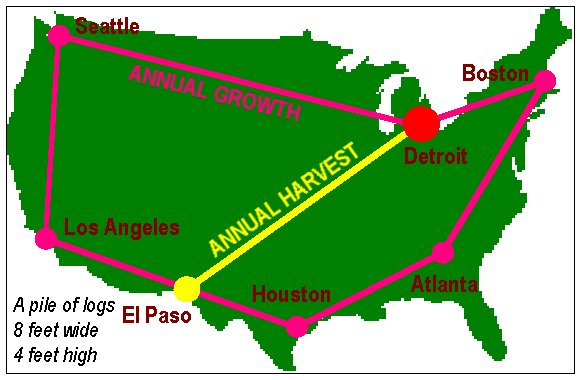
Let's imagine a pile of eight-foot logs stacked four feet
tall. How far would that pile stretch? 4329 miles! And how far is that?
How about a round trip to from Detroit to Salt Lake City!
Hmmm. IS that a lot of wood? In a way, sure. But what can we compare that volume to? Let's take a look at how much GROWS in Michigan each year. That pile runs to Dawson City, in the Yukon Territory . . . and back again! The volume is over 700 million cubic feet of wood, or about 8.8 million cords. The mortality pile, that volume that dies in the woods, would fill a cord pile to San Diego and back. That volume amounts to about 450 million cubic feet, or about 5.7 million cords. Mortality volumes are larger than harvest volumes.
|
While harvest volumes are huge, they must be examined in context with the standing volume, as well as net growth and natural mortality. Each year, Michigan grows almost twice the volume that is harvested. That rate has been declining somewhat, but because of either growth or harvest. Rather, natural mortality volumes have been increasing, cutting into the net growth volumes. Harvest volumes have remained somewhat steady. It's also important to note that ratios among growth, harvest, and mortality vary across the state, sometimes substantially. However, there are no regions where standing volumes are declining. With predicted increases in human populations and urban sprawl, both forest area and volume trends are expected to reverse (decline) over the next couple of decades. Despite some common perceptions, nearly two-thirds of the country's forest volume lies in the eastern United States. And, more than half the forest area lies in the east. While the west is known for huge trees and lots of volume per acre, most of the western forest is stocked at lower levels than those forests in the east. In fact, overall, on average, in 2012, western forests have about 16 cords/acre and eastern forests have about 20 cords/acre.
|
||||||
Who owns the land where our wood comes from? |
|||||||||||||||||||
Another way to look at the situation is who's delivering the biggest pieces of the harvest pie. Having lots of acres in a category helps. The top five largest pieces of the pie are Michigan family forest, Minnesota family forest, Michigan corporate forest, Michigan state forests, and Minnesota county forests. Together, these five entities contribute two-thirds of the Lake States harvest volume. Lumping these 19 categories into four groups, the most "productive" ownership is forest industry (28.8 cubic feet / acre), followed by state & county forest (19.3), family forests (17.7), and federal forests (7.0). Differences in forest composition also help explain part of the variance. Minnesota is much heavier to mature aspen, which has been extensively clearcut for harvest and regeneration. Michigan has a greater area of northern hardwood types, which is typically thinned and selectively logged. Other differences between the three states are forest tax laws and commitment to private forest assistance by the state governments.
|
|
||||||||||||||||||
 |
This website was developed and created by Michigan State University Extension for the teachers of the State of Michigan. |

