Home Page |
MICHIGAN FORESTS FOREVER TEACHERS GUIDE
| MICHIGAN FOREST DESCRIPTORS |  |
 |
The number of forest acres is a critical measure. Acreage can be viewed in:
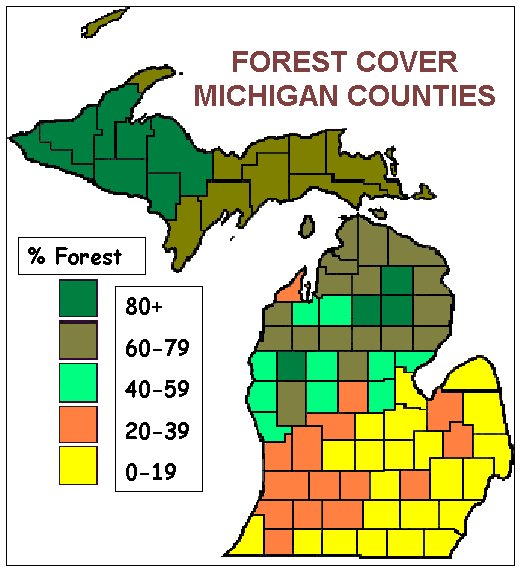
About half (53 percent) of Michigan is forested. Most of the forestland lies in the north. Most of the southern counties are largely unforested. Prior to American settlement, about 95 percent of what is now Michigan was forested, or about 35.5 million acres (Chase, et al., 1970). The conversion of forest to other uses, or deforestation, was caused primarily by agricultural activities and secondarily by cities, roads, and similar development. A common myth is that logging, fires, and failure to plant trees is responsible for deforestation. In reality, forest ecosystems can recover from all these activities.
Michigan’s forest area has been fairly constant since 1953. However, between 1980 and 1993, the total forest area increased by nearly a million acres (or about five percent) to a total of 19,280,000 acres. The timberland acreage (forest open to timber harvest) increased 1.1 million acres (or about seven percent) to a total of 18,615,900 acres (Leatherberry & Spencer, 1993). Total forest has specific definitions, but is basically forest with minimum specifications for area and stocking of trees. Timberland, on the other hand, has additional specifications for productivity and is not withdrawn from timber harvest by law or regulation. Timberland is a subset of total forest area and is the basis of most of the forest statistics used in this Guide.
Michigan has the fifth largest area of timberland in the USA! Georgia, Oregon, Alabama, and North Carolina have larger acreages. Note that four of the five largest forests are in the eastern USA. In fact, of the nearly half billion acres of forest in our nation, about three-quarters grows in the eastern states (Smith et al., 1994).
Return to the TOP
of the Descriptors Page
Return to TREE BASICS page.
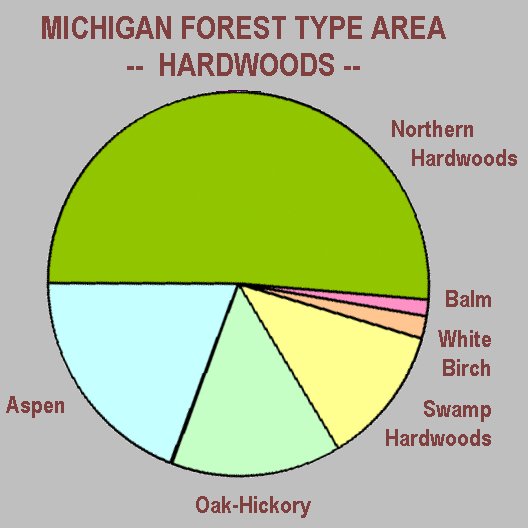
A forest type has similar associations of tree species. The types are named by the dominant tree species. So, an aspen type has a lot of aspen, but may also have a large number of other tree species. Michigan is dominated by hardwoods, or broad-leaved trees, making up about 75% of the forest area and timber volume.
Michigan's largest forest type, measured in any manner, is by far our northern hardwoods. It occupies nearly 40% of the forest landscape and 45% of the timber volume. Northern hardwoods is an association of sugar maple, red maple, basswood, beech, and yellow birch. It is not simply hardwood trees that grow up north. Northern hardwoods have been increasing in area and volume for decades, due to the natural process of succession and to forest management practices.
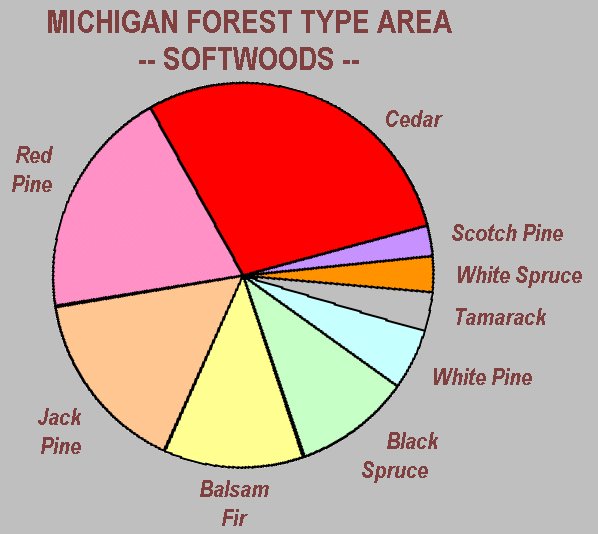
Our most common softwood forest type is northern white cedar, again by a fairly wide margin. Much of our wetlands are occupied by cedar forests. The pine types, taken as a group, are more prominent than cedar, excluding Scotch pine. Scotch pine is an exotic species from Europe that has been widely planted in Michigan. Today, most of the Scotch pine acreage is in Christmas plantations (or abandoned plantations!).
| MICHIGAN FOREST TYPE AREA AND TIMBER VOLUME | |||
| Forest Type | Acres | 1000 Cubic Feet |
|
N.
Hardwood Total |
7,161,300 18,615,900 |
11,810,324 26,661,192 |
|
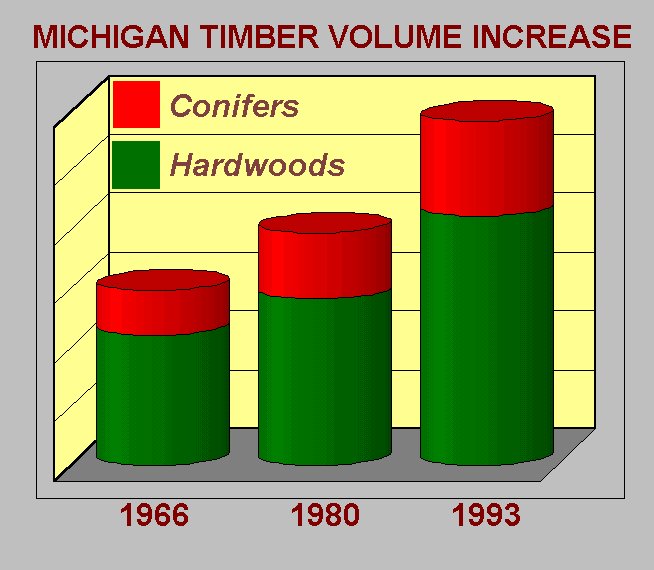 |
Timber volume is more than a useful measure of a raw material natural resource. It also serves as a reasonable, though incomplete, measure of biomass. If timber volumes are increasing over time, then our forest is growing, even if the acreage remains about the same. This is the case in Michigan.
In 1993 (the most recent statewide data), Michigan had 26.6 billion cubic feet of timber. Hmmm. How much is that?! If we converted those cubic feet into cords, there would be 337 million cords (about 79 cubic feet of wood per standard cord). A cord is a stack of eight-foot logs or pulpsticks four feet high and four feet wide. If we would lay all those cords side by side, the pile would stretch over 255,300 miles, or about 10.5 times around the Earth! That’s a LOT of wood!
Critical thinking will lead us into exploring a bit deeper than just the overall timber volume on a state-wide basis. We should consider looking at volume changes by species and forest type, because this is the basis upon which forests are managed. We can also look at volume changes by tree diameter class or poletimber and sawtimber size classes. Trends within a given species, forest type, or size class might also vary by geographic region! And, of course, this won’t tell us much about the quality of the standing timber or the level of rot and cull.
The amount of change will vary by each classification. Also, an upward / downward or faster / slower trend is not necessarily "good" or "bad." Consideration must be given to the biological differences among tree species and forest types. The ecology of forest types dominated by species such as aspen and jack pine follow natural "boom and bust" cycles. Northern hardwoods, on the other hand, tend to remain more "steady" in their volume / biomass trends, once they increase to a certain level. Only American elm has experienced actual volume losses between 1966 and 1993, due to Dutch elm disease. Although, ash species may experience a similar decline due to the emerald ash borer.
For example, sugar maple and red maple volume has increased more than any other tree species. Not only that, but their rate of increase is increasing. This reflects natural succession of Michigan forests since the logging era around the turn of the last century.
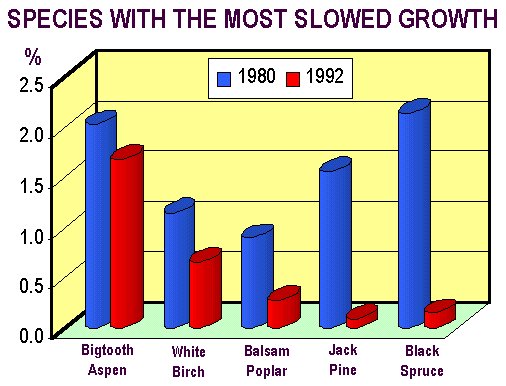
Some tree species have experienced low levels of volume increases since 1966 and have decreasing rates of volume accumulation. These species tend to prefer in earlier successional forest types which will decline in an unmanaged landscape. A few of these species are black spruce, jack pine, paper birch, and bigtooth aspen. These are some of Michigan’s most common species . . . today! Keep in mind that forests are always changing.
Volume Changes by Common Michigan Tree Species 1980-1993 |
|
Top Five Increases |
Bottom Five Increases |
Sugar Maple |
Bur Oak |
| "Common" is defined
as tree species with at least 25 million cubic feet of volume. Source: US Forest Service FIA data from 1993. |
|
Return to the TOP
of the Descriptors Page
Return to TREE BASICS page.
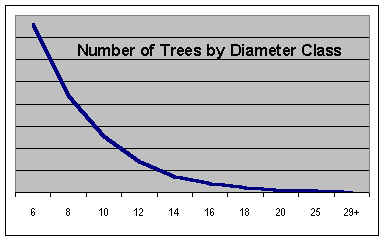 |
People often want to know how many trees are in Michigan. The answer is about 11.4 billion. This includes all live trees with a diameter of at least one inch. That number is not much different that the 11.3 billion trees in 1980. Because of the significant increase in volume since 1980 (9.5 billion cubic feet or an increase of 48 percent), we can surmise that the average tree size has grown.
The number of trees, as a fact by itself, doesn’t really tell us much about the forest. We need to consider other measures, such as the volume within each of the size classes.
An easy to understand graph shows that there are more trees in smaller diameter classes. Why is that? For the same reason that there are fewer frogs than tadpoles. Smaller and younger organisms are more prone to natural mortality factors. Few trees live to the end of their natural longevity potential.
Return to the TOP
of the Descriptors Page
Return to TREE BASICS page.
| Definition: dbh (diameter at breast height): Foresters measure tree diameter at a standardized height of 4.5 feet above the ground. This height usually avoids natural swelling from the tree butt in addition to being a convenient height. Irregularities in trunk form and on the ground have necessitated a host of rules about where to measure diameter. |
| Definition: Basal area is the cross-sectional area of a tree trunk at a point 4.5 feet from the ground, usually measured in units of square feet in the USA. Basal area per acre is the number of square feet per acre. Mature stands of trees in Michigan that are fully stocked usually have basal area values between 100 and 200 square feet per acre. |
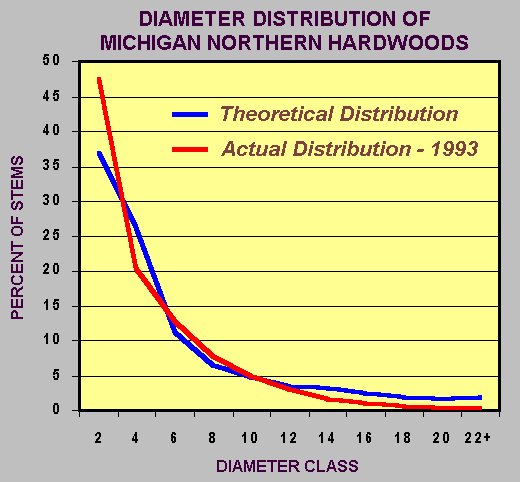 Source: USFS Forest Service FIA data. Theoretical curve is based on Tubbs, 1977. |
The distribution of size classes tells us quite a bit about stand structure. Based on research, forest types have optimum size class distributions, sometimes dependent upon age.
Tree "size" usually refers to the diameter at breast height (dbh) or to product classes such as "pulpwood" and "sawtimber." Height is not usually considered when resource managers refer to tree "size."
"Basal area" or the number of trees is generally how size classes are measured, or in other words, the amount of basal area or number of trees per size class. Basal area is a measure of stand density, more descriptive than simply the number of trees.
Size class distribution is more relevant when we talk about certain forest types, such as northern hardwoods (sugar maple, beech, yellow birch, et al.). Trees in this forest type will grow well in partial shade. They have the potential to become a forest with trees of many ages. Foresters call this an "all-aged" or "uneven-aged" forest. Size class distribution within a given stand of trees can tell us how close the stand is to an "ideal" distribution.
In "even-aged" stands, most of the trees are within a fairly narrow range of ages, but not necessarily the same size. Stands of shade intolerant trees are naturally all about the same age because they usually regenerate after some catastrophic event (fire, windstorm, insect epidemic, or timber harvest) that opens up the forest floor to a lot of light. The subsequent reproduction is roughly the same age. Size class discussions of even-aged stands refer more to the distribution of stands, rather than individual trees within a stand.
Return to the TOP
of the Descriptors Page
Return to TREE BASICS page.
Stand composition in forestry is similar to what biodiversity is to an ecosystem. The number of tree species and their relative abundance in a stand are important pieces of information. Because forestry practices occur at the stand level, we commonly think of stand composition when prescribing treatments. However, we can also look at the composition of forest types on a statewide or regional basis.
Generally speaking, forests with greater tree diversity also have greater overall biodiversity. Our most diverse forest type, at least in terms of the number of tree species, is northern hardwoods. The least diverse forest type is tamarack. But simply the number of trees does not tell the whole story.
| Definition: Stand: A group of trees which is similar in terms of composition, structure, age, history, and other biological characteristics, and is different than the surrounding forest. |
In terms of tree species abundance (species richness), our most diverse type is swamp hardwoods and the least diverse type is red pine. To help explain the "species abundance" concept, imagine two forest types, each with ten species of trees. In forest type one, each of the species comprise ten percent of the total number of trees. This is a species rich stand. In forest type two, one species dominates by comprising 91 percent of the total number of trees. The other nine species each occupy only one percent of the total number of trees. This is NOT a species rich stand.
| Forest Type |
# Tree Species |
Forest Type |
%
Volume in One Species |
Forest Type |
Acreage |
| Northern
Hardwoods Oak-Hickory Swamp Hardwoods Aspen Red Pine N. White Cedar Paper Birch Balsam Fir White Pine Balm-of-Gilead Jack Pine White Spruce Black Spruce Tamarack |
71 63 57 50 40 36 35 32 32 27 26 25 22 22 |
Swamp
Hardwoods Balsam Fir Northern Hardwoods Oak-Hickory Aspen Paper Birch White Spruce Black Spruce Balm-of-Gilead White Pine Tamarack N. White Cedar Jack Pine Red Pine |
26.9 27.4 32.0 35.1 35.3 40.8 41.5 48.5 49.6 58.0 62.0 64.7 71.9 77.2 |
Northern
Hardwoods Aspen Oak-Hickory Swamp Hardwoods N. White Cedar Red Pine Jack Pine Balsam Fir Black Spruce Paper Birch White Pine Balm-of-Gilead Tamarack White Spruce |
7,161 2,676 1,982 1,627 1,349 897 846 563 465 292 234 190 149 147 |
| Source: U.S. Forest Service FIA data for Michigan, 1993. | |||||
Return to the TOP
of the Descriptors Page
Return to TREE BASICS page.
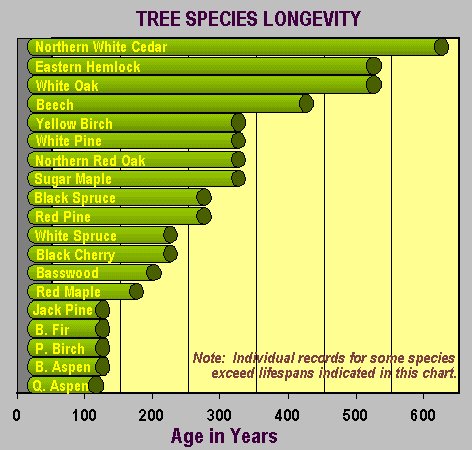 |
Trees only live so long. Average lifespans vary from 60 years to two or three centuries. Different tree species have different lifespans. Shorter lived species tend to live in stands that are about the same age. This is because their life cycle strategy often involves reforesting small or large forest areas killed by fire, windstorm, or insect outbreak. Longer lived species have different strategies, tend to be more tolerant of shady conditions, and therefore often live in stands where trees are of multiple ages or all ages. We call these stands uneven-aged.
Sampling the age of trees in a same-aged stand, or even-aged stand, tells foresters how close the stand is to maturity and when the best time to regenerate the stand would be. In terms of tree regeneration, clearcutting resembles natural stand-replacing events (fire, etc.). Although clearcutting is not exactly the same, it is a reasonable technique to regenerate even-aged forests in the Lake States. However, it is not without controversy.
Landscapes consist of a mix of even-aged and uneven-aged forest types. Foresters attempt to maintain even-aged forest types by staggering the harvest and regeneration of stands so that a balanced age class distribution occurs in the landscape. However, there are many complications that make this a difficult task.
Return to the TOP
of the Descriptors Page
Return to TREE BASICS page.
| History Note: Most public lands originated from tax delinquent lands in the first half of the 1900s. In Michigan, the state assumed ownership over much of this property. In Wisconsin and Minnesota, the counties assumed control over much of the tax delinquent land within their boundaries. |
| Forest Fact: The Upper Peninsula is one of the few regions in the United States where there are large ownerships of both public forests and industrial forests. With nearly three-quarters of the forest in these ownerships, it is very likely the U.P. will continue to have large, uninterrupted expanses of forest. This has important ecological benefits. |
|
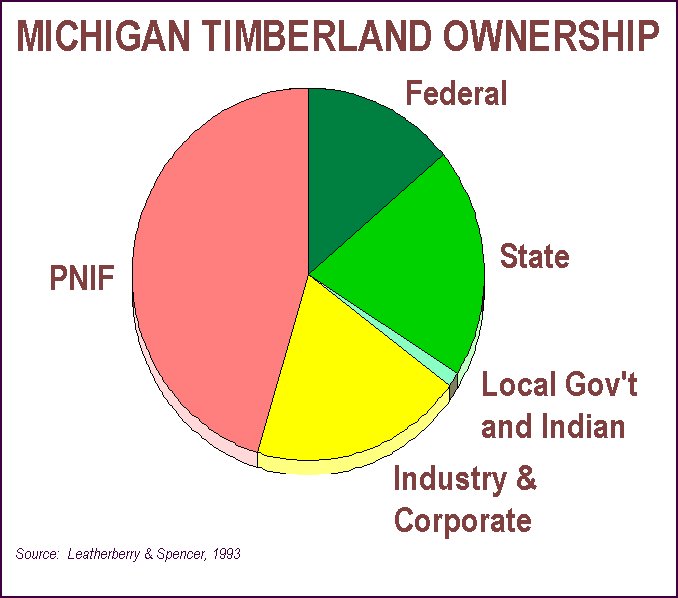
The owner or ownership of a forest will determine how that forest will be managed (or not managed). There is no single way to properly manage a given forest type. However, there are innumerable poor ways.
Public lands tend to be managed for multiple uses of more or less equal importance, although this is arguable. National Forests (federal ownership) are not managed the same as State Forests. Michigan also has three County Forests and several Indian Reservations.
Industrial forest management tends to be focused more on timber management, but does consider a full complement of multiple uses, similar to public lands. Michigan has a greater proportion of industrial forest than either Wisconsin or Minnesota. Industrial ownerships are broken into two major categories, those that operate wood-using mills and those that do not. In Michigan, nearly all the corporate land is now owned by investment companies and not mill-owning industries. Plum Creek, The ForestLand Group, and the Keweenaw Land Association manage large acreages but do not own a wood-using mill.
Private Non-industrial forest (PNIF) ownerships are the family forests, hunt clubs, and similar individuals and groups. Michigan has about 320,000 of these ownerships, with the number growing each year. The range of forest management varies across the spectrum. It is interesting to note that of all the ownership classes recognized by the FIA data in the Lake States, the Michigan PNIF class is the least productive in terms of timber production.
The amount of timberland held by PNIF owners varies widely across the state. Menominee County has the largest PNIF timberland acreage and Keweenaw County the least. Even the counties in the Detroit metro area have more acres of PNIF timberland than Keweenaw County! That's because nearly 90 percent of Keweenaw County timberland is owned by forest industry or other corporations, which is another unique attribute of the county. But generally, counties in the south are heavy to PNIF ownership because northern Michigan has the large public and industrial ownerships. The PNIF average size (including forest industry and corporate land) ranges from 118 acres in the western U.P. to 17 acres in the southern L.P. The statewide average is 34 acres.
| Ownership of Michigan Timberland by Region (1000 acres) | ||||||||||
| Region | Total Timberland |
Federal Forest & Parks |
State | County/ Municipal |
Indian | Forest Industry and Corporate |
PNIF | PNIF% | All Public (percent) |
All Private (percent) |
| Eastern UP Western UP Northern LP Southern LP All State |
3,808.9 18,615.9 |
784.4 880.5 912.9 14.2 2,592.0 |
937.2 616.7 1,936.3 238.0 3,728.2 |
12.7 90.0 68.0 85.6 256.3 |
8.2 6.4 0 0 14.6 |
824.5 1,919.1 572.9 259.8 3,576.3 |
1,241.9 1,076.7 3,726.8 2,403.1 8,448.5 |
32.6 45.4 |
45.7 34.7 40.4 11.3 35.4 |
54.3 65.3 59.6 88.7 64.6 |
| Source: Leatherberry & Spencer, 1993 | ||||||||||
| A disturbing trend: Increasingly smaller ownership parcels make management increasingly difficult, converts more forest to uses such as homes, lawns, and driveways; and increases the amount of forest "edge" and human disturbance in the landscape. The process of "parcelization" is often called "fragmentation". Forest ecologists tend to use the term "fragmentation" to describe a forest that is increasingly converted to non-forest uses . . . the actual loss of forest cover, especially larger forest blocks being converted into increasingly more numerous smaller blocks. It is better to use the word fragmentation to describe the ecological effect of chopping up forest blocks. |
Return to the TOP
of the Descriptors Page
Return to TREE BASICS page.
Growth, Harvest, and Mortality
| Definition: A cord of wood is a pile of 8 foot long pulpsticks that is 4 feet high and 4 feet wide. A cord of wood contains about 79 cubic feet of solid wood. |
The volumes of wood grown, harvested, and dead from natural causes have little meaning unless compared to each other and compared to the volume of standing timber. Additionally, the growth-harvest-mortality relationship can be established by geographical region, forest type, and individual tree species.
Michigan’s forest has continued to grow in volume since statewide inventories began in 1952. Since 1966, timber volumes have nearly doubled. Between 1980 and 1992, volume increased at an average rate of 760 million cubic feet of wood per year. That’s enough wood to lay cords of wood side by side for about 7300 miles! Each year!
Harvests averaged 274 million cubic feet per year during the same period. That’s enough wood to build that cord pile about 2600 miles! That, too, is a lot of wood!
Natural mortality (disease, insects, fire, wind, flooding, etc.) took 200 million cubic feet of wood per year, also between 1980 and 1992. Using the same cord pile conversion, the pile would go about 1900 miles.
By Region
 Source: U.S. Forest Service FIA data, 1993. |
The bar chart to the left clearly
demonstrates that growth exceeds harvest by a wide margin in all four regions of Michigan.
The period the data cover are the years 1980-1992. The best growth has been
in the Lower Peninsula, which is expected due to the better soils, longer growing season,
and different species mix. "Growth" reflects net growth, or the volume of timber grown after mortality is subtracted. Mortality includes all causes of tree death except harvest. That is shown separately, but contrary to mortality, harvest is not subtracted from gross growth to show net growth. In other words, the harvest bars have not yet been subtracted from the growth bars, but the mortality bars have been subtracted. |
By species
|
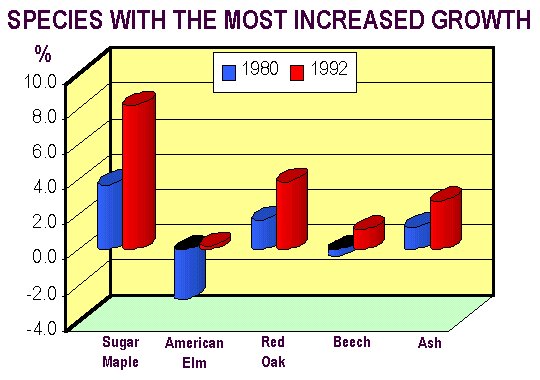
Michigan can rest comfortable knowing that timber stocks have been increasing vigorously. However, that isn't necessarily the case with all species. Some species stocks are growing faster than others and the rates of increase of other stocks have begun to drop. American elm is the only species that has less volume than it did in 1966, the result of Dutch elm disease (an exotic disease). However, elm stocks have grown significantly since the 1980 inventory. Eleven species have rates of increase that dropped during the last inventory period (1980-1992) as compared to the previous period (1966-1980). Several reasons for the slow down are apparent, including inventory definitional changes, older stages of forest succession, aging trees, and forest pests. Stocks of butternut, tulip poplar, balsam fir, black walnut, white spruce, basswood, bigtooth aspen, white birch, balm-of-Gilead, jack pine, and black spruce have statewide growth rates that are beginning to slow down. Species stocks that showed increasing rates of growth are sugar maple, elm, red oak, beech, ash, red pine, quaking aspen, cedar, and others. Sugar maple, in particular, continues to rapidly increase its presence in the forest landscape. |
By forest type
 |
All forest type groups in Michigan have
increased in volume between 1980 and 1993. The northern hardwoods growth,
alone, accounts for nearly half the volume of timber grown in all Michigan forests during
the last inventory measurement period. Spruce-Fir types and Northern Hardwood types increased by the greatest percentage, each in the middle teens. The Pine, Oak-Hickory, Swamp Hardwood, and Aspen-Birch types increased less aggressively, at 5.3, 5.1, 3.2 and 2.0 percent, respectively. Much of the pine and aspen were reaching maturity throughout the 1980s and into the 1990s, which means slower growth. Also, the forest industry harvested more of the volume as it matured, especially with the aspen resources. |
| A note on intensive forest management: One of the objectives of forest management is to move more wood into the growth category from the natural mortality category. However, it’s important to note that dead wood plays an important part in forest ecology. A piece of land has a maximum biological potential to produce wood tissue. Statewide, that potential is estimated at 63 cubic feet per acre per year (almost one cord). Between 1980 and 1992, the actual annual growth increased from 35 to 44 cubic feet per acre. [Leatherberry & Spencer, 1996] |
Return to the TOP
of the Descriptors Page
Return to TREE BASICS page.
Michigan’s Forest Relative to Other States and In The World
State
Timberland Acreage |
|
| Georgia Alabama Oregon North Carolina Michigan Arkansas Mississippi Maine Washington California |
23,631,000 |
| These 10 states make
up 38% of the total national timberland acres. Source: USFS RM-234, 1993. |
|
Michigan has the fifth largest area of "timberland" among the 50 states. It has the second largest area of timberland that is state-owned.
Area and volumes have been increasing in the east, while the opposite has been true in the west. Declines in the west have not necessarily occurred because of poor forestry or timber harvesting practices. It's more a matter of the nature of the timber types and regenerating even-aged mature stands. This, of course, has been a controversial trend.
Most of the U.S. forest, by area and volume, lies EAST of the Mississippi River.
States
With The Highest |
|
| California Washington Oregon Alaska Idaho [Michigan] |
3,541 |
| Source: USFS RM-234, 1993. | |
The eastern timberland makes up 73 percent of the total area. In terms of volume, the eastern timberland has 58 percent. Volumes per acre are significantly higher in the west, which has contributed to the notion of the west having more forest. Softwood (conifers) volume is higher in the west (two-thirds of the national supply), which is what construction wood products are largely made from. This, too, has contributed to the idea of more forest in the west. Our national hardwood resource has a suite of products that are harder to identify with.
Seven of the top
ten forested states, by area, are eastern states.
Of the top ten forests by volume, seven of ten are in the west.
State
Timberland Volume |
|
| Oregon California Washington Alaska Idaho North Carolina Georgia Montana Virginia Maine [Michigan] |
68,222 |
| These 10 states make
up 50% of the total national timberland growing stock volume. Source: USFS RM-234, 1993. |
|
States
Where Timber Volume |
|
|
Softwoods
Montana |
Hardwoods Kansas |
| Note:
Timberland growing stock. Source: USFS RM-234, 1993. |
|
In terms of timber volume (not area), Michigan ranks 13th. Most of our volume is in hardwood, which is a characteristic Michigan shares with all the eastern states except Georgia, Louisiana, Texas, Florida, and Maine. In the west, softwoods dominate forest volume, except in Hawaii, North Dakota, Kansas, and Nebraska.
Across the entire USA, softwood accounts for 57 percent of all timberland growing stock.
Within a global context, Michigan has some of the finest forests in the world. Our north temperate forests are ecologically resilient and highly adapted to change and disturbance. Furthermore, much is known about how to effectively manage these forests. Not all regions of the world can make a claim such as this. It's one good reason to manage our forests as well as possible.
For a good summary of the U.S. forest condition and trends over the last 50 years or so, read "U.S. Forest Facts and Historical Trends", which was prepared by the U.S. Forest Service in association with the 2000 Renewable Resources Planning Act Assessment. The same document can also be downloaded as a PDF file (need Adobe Acrobat Reader). To better understand the global impact of wood and forests, essays by Dr. Jim Bowyer and Dr. Patrick Moore are recommended.
Return to TOP of
Page
Return to TREE BASICS Page
 |
This website was developed and created by Michigan State University Extension for the teachers of the State of Michigan. |
Page Name:
TreeBasics/Descriptors.htm